Download
1 / 16
160 likes | 307 Vues
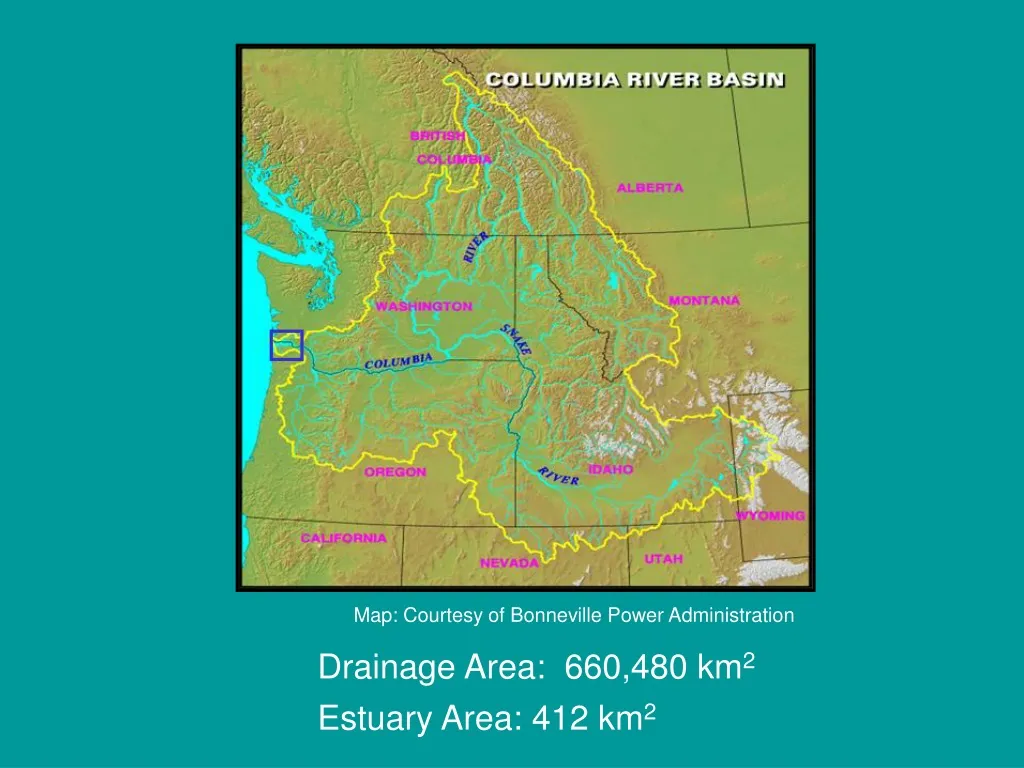
Map: Courtesy of Bonneville Power Administration. Drainage Area: 660,480 km 2 Estuary Area: 412 km 2. Habitat Changes in the Columbia River estuary. Total area loss = 24%. 50,000. - 65 %. + 10 %. 1870. 1980. 40,000. - 7 %. - 25 %. 30,000. Acres. 20,000. + 293 %. 10,000. 0.

E N D
Map: Courtesy of Bonneville Power Administration Drainage Area: 660,480 km2 Estuary Area: 412 km2
Habitat Changes in the Columbia River estuary Total area loss = 24% 50,000 - 65 % + 10 % 1870 1980 40,000 - 7 % - 25 % 30,000 Acres 20,000 + 293 % 10,000 0 Deep Water Medium Depth Shallow/Flats Tidal Marsh & Uplands- Natural Swamp & Filled Data Source:Thomas, T.W.1983. Changes in Columbia River estuary habitat types over the past century. CREDDP.
BENTHOS BENTHOS HISTORIC AND MODERNCOLUMBIA RIVER ESTUARY FOOD WEBS Pre-1870 Modern (1980) PHYTO- PLANKTON ZOO- PLANKTON FLUVIAL INPUT ZOO- PLANKTON DETRITUS PHYTO- PLANKTON DETRITUS 73000 9000 25 146495 61440 102 EMERGENT PLANTS EMERGENT PLANTS 5300 36205 11324 3605 19938 62629 BENTHIC ALGAE 1893 10525 ? ZOO- PLANKTON PHYTO- PLANKTON ZOO- PLANKTON ? 1545 ZOO- PLANKTON DETRITUS BENTHIC ALGAE ZOO- PLANKTON PHYTO- PLANKTON DETRITUS 279 1825 14587 282 167 ? ? ? 1943 ? 167 ? EPI- BENTHOS EPI- BENTHOS BENTHOS EPI- BENTHOS BENTHOS EPI- BENTHOS 34 26 355 26 OCEANIC EXPORT 80000 ? ? ? 159185 ? 40560 24
Effects of Flow Regulation Monthly Average Flows at The Dalles 1970-1999 • Reduced peak freshet flow by >40% • Freshet longer and peak flow earlier • Greatly increased fall-winter minimum flows
Recommendations from Salmon at River’s End • Monitor life-history diversity, habitat use, and performance of juvenile salmon • Protect and restore emergent and forested wetlands and riparian floodplains • Use physical observations and modeling to assess changes in habitat opportunity • Assess the effects of altered habitats and food webs on juvenile salmon
Estuarine Monitoring: Salmon Abundance & Life History Beach seine (landscape scale) Marsh trap (habitat scale)
Salmon-Habitat Relationships Emergent & Forested Wetlands D. Bottom, NMFS & C. Simenstad, UW • Fish abundance and life history • Prey availability and fish food habits • Physical attributes • Vegetative communities
CORIE Historical, active Historical, recent extensions Historical, temporarily discontinued This project, active Planned for 2002 Biological monitoring • water level (pressure) • salinity • temperature • velocity profiles (5 sites) Estuarine Monitoring and Modelling: Physical Attributes & Habitat Opportunity
Focus area of NMFS project Habitat Change Assessment completed 1983 Columbia River Estuary Habitat Change Analysis
Historic Habitat Opportunities and Food-Web Linkages of Juvenile Salmon in the Columbia River Estuary and Their Implications for Managing River Flows and Restoring Estuarine Habitat Ed Casillas, Daniel Bottom, Curtis Roegner, Kym Jacobson, & Cathy Tortorici National Marine Fisheries Service Charles Simenstad University of Washington Antonio Baptista, David Jay, & Todd Sanders Oregon Graduate Institute Eric Volk Washington Department of Fish and Wildlife
Historic Reconstruction: 1. Baseline conditions and modifications? Simulation Modelling: Food-Web Sources: 2. Effects of change on habitat opportunity? 3. Effects of change on salmonid food webs? Research Goal Reconstruct historic changes in estuarine rearing opportunities and food-web linkages of Columbia River salmon and evaluate their implications for managing river flows and restoring estuarine habitats. Restoration Scenarios: 4. Implications for restoration?
Historic Reconstruction • Establish a consistent historic habitat baseline from the river mouth to Bonneville Dam. • Develop baseline of aquatic, intertidal, and floodplain habitats from historic T-Sheet and H-Sheet data. • Reconstruct historic climatic, tidal, and hydrologic effects on overbank flooding and access to floodplain.
Simulation Modelling • Use historic baseline to run 3-D simulations of habitat opportunity based on selected criteria: • --depth (0.1-2.0 m) • --velocity (< 30 cm/s) • --salinity (< 5 ppt) • Evaluate sensitivity of habitat opportunity to past (1) diking & filling, (2) flow regulation, and (3) channel deepening.
Food-web Sources • Characterize changes in estuarine food webs of salmon and the organic sources supporting them • Stable isotopes: • --Carbon sources of different salmon life-history types • --Isotopic signatures of dominant estuarine and freshwater prey • --Otoliths to assess changes in prey linkages • Parasites: • --Parasite assemblages as indicators of diet and habitat use • Scale microchemistry: • --Potential for describing historic food-web linkages
Restoration Scenarios • Review results of monitoring, simulations, and historic analyses • Identify alternative restoration scenarios (workshop). • Construct simulation database for each scenario. • Analyze impact of alternative scenarios for estuarine habitat and salmon