Download
1 / 33
330 likes | 475 Vues
Big City Density and Sun Belt Sprawl. America’s Major Metropolitan Areas in the 2000s. Agenda. Recapping A Decade in a Few Minutes Metro Areas, the Census and American Community Survey Population Changes in the 2000s Differences on Transportation Income Poverty. During the 2000s….

E N D
Big City Density and Sun Belt Sprawl America’s Major Metropolitan Areas in the 2000s
Agenda • Recapping A Decade in a Few Minutes • Metro Areas, the Census and American Community Survey • Population Changes in the 2000s • Differences on • Transportation • Income • Poverty
During the 2000s… • America grew in several ways* • Suburbs • 12% population growth • Central cities • 7% population growth • Some see an economic revitalization in areas beyond “Downtown” • More than twice as many people live in suburbs vs. central cities *Sources: Brookings Institute, State of Metropolitan America Map , New York Times, Mapping America: Every City, Every Block and SustainableCitiesCollective (blog), “New Census numbers confirm the resurgence of cities”, December 15, 2010,
During the 2000s… • Mid-decade economic boom driven by real estate… which busts in 2007-2008 • Properties de-value, foreclosures rise • Greatest impact felt in • Several of the fastest growing metro areas • “Exurbs” – areas relatively far from central cities • “Drive ‘til You Qualify”
During the 2000s… • Budgets are squeezed • Gas prices drive up transportation costs (among other things) • Declining property values and ballooning mortgage interest rates • Poverty rate grows faster in suburbs than in central cities* • Real wages fall more among suburban households* *Source: Brookings Institute, State of Metropolitan America Map
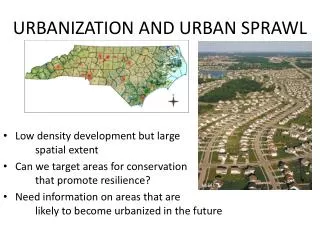
Metro Area Trends • Differences between higher density metros of America’s major cities and lower density, high growth metros in the Sun Belt • Transportation • Primary commuting alternatives to driving alone • Income levels • Poverty rates • County-level trends within these two sets
54 Metro Areas with 1 Million People or Greater* *2000 Census based on 1999 MSA definitions, or 2007-2009 American Community Survey based on 2003 CBSA definitions
Change in Metro Area Definition • Federal Office of Management and Budget (OMB) defines Metro Areas • Revised in 2003* • Previously – Metropolitan Statistical Area (MSA) • Commuting relationship between central city and surrounding counties • New – Core Based Statistical Area (CBSA) • Examine commuting patterns between counties • Urban core – ‘central city’ or several communities • # of metropolitan areas grew from 280 to 362 • Suburbs of large MSAs split off • Areas are smaller, but likely more dense • Pop density figures in 2012 when metro area data for 2010 Census is released *Source - Office of Management and Budget, Standards for Defining Metropolitan and Micropolitan Statistical Areas; Notice, Federal Register, Vol. 65, No. 249, 12/27/00
2000 Census and 2007-2009 ACS • 2000 Census • Entire population • 1/6 of households –survey on housing and economic status (discontinued for 2010 in favor of ACS) • Metro Area statistics • CBSA – population count • MSA – population density and characteristics • American Community Survey (ACS) • Surveys 2 million households each year, official since 2005 • Similar to longer-form 2000 census survey • 3-year average reduces margin of error • Info on geographic areas with pop. of 20K or greater (annual info for areas with pop. of 65K or greater) • Limitation - economic and social change during time period • CBSA - all metro area data • Overcame differences with 2000 Census by looking at county-level data
In Summary • Denser metro areas of our major cities may have slower growth rates, but • Higher incomes • Lower poverty rates • Extensive rail networks help lessen auto-dependency • Sun Belt – High growth, lower density • Sprawling • Auto-dependent • Lower incomes • Growing suburban poverty • As transportation costs increase, could residents find themselves isolated from jobs? • Some regions taking action
Sun Belt Regions Adding Transit • Sprawling development patterns limits reach of these systems *Source:Federal Transit Administration, National Transit Database, Glossary; Websites of transportation agencies in above-mentioned cities and regions
Fed Policy Initiatives • HUD, DOT and EPA Partnership for Sustainable Communities1 • Grants to 45 regions in December, 2010, including agencies in Austin, Greensboro and Houston • Development of joint sustainability, affordable housing and transit plans 1Partnership for Sustainable Communities Website, www.sustainablecommunities.gov