Download
1 / 30
300 likes | 435 Vues
Money market instruments Basic features: Short-term debt obligations of large corporations and governments that mature in a year or less. Highly liquid and relatively low-risk debt instruments. Examples

E N D
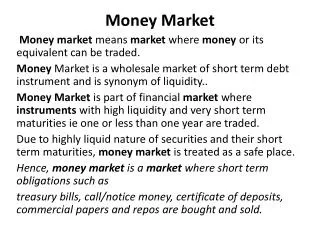
Money market instruments • Basic features: Short-term debt obligations of large corporations and governments that mature in a year or less. Highly liquid and relatively low-risk debt instruments. • Examples • T-bills: short-term (91 days, 182 days, and 52 weeks) highly liquid US government securities issued at a discount from the face value and returning the face amount at maturity. Minimum denominations of $10,000 • Commercial paper: short-term unsecured debt issued by large corporations.
Fixed-income securities: longer-term (at least 1 year) debt obligations of corporations and governments that promise to make semiannual coupons and returning the face value at maturity. Ex) • Treasury bonds or notes: T-note maturities range up to 10 years (currently 2, 5, and 10 years), while T-bonds have 10 to 30 years. Minimum denominations of $1,000.
Treasury Inflation Protected Securities (TIPS) In Jan. of 1997, the US Treasury started selling securities (both notes and bonds) whose coupon rate adjusted periodically with the change in the rate of inflation. Changes in inflation rate are reflected in the principal and not the coupon rate. The inflation-adjusted principal is multiplied with the coupon rate to computed the interest payments to investors. These adjustments are made semi-annually.
e.g) Suppose that a TIPS purchased July 1 has a coupon rate of 3%. The par value of the principal is $100,000. Assume that annualized inflation is 4% for the next six months. The inflation-adjusted principal: The semi-annual inflation rate is 4%*0.5 = 2%. This is applied to the principal of $100,000 which gives the inflation adjusted principal of $100,000 (1+0.02) = $102,000 Semiannual coupon payment: 102,000*0.015 = $1,530
Municipal securities (Munis) Debt issuances by state and local governments in the U.S. Interest income from these securities is exempt from U.S. Federal taxes but capital gains are not. General obligation munis (GOs) are backed by the “full faith and credit” of the taxing governmental unit Revenue bonds are supported through revenues generated from projects that are funded with the help of the original bond issue.
Investment securities are defined as those securities with maturities greater than one year Q) Why are Treasury bills not considered to be investment securities? ANSWER: Because they are short-term money market instruments with maturities less than one year. They are held more for liquidity purposes than for investment income.
The composition of the securities portfolio of all U.S. commercial banks in 1998 • U.S. government agency securities (that are not direct obligations of the U.S. Treasury but nonetheless are federally sponsored or guaranteed): about 10% of total assets • U.S. Treasury (2.2%) Other (2.5%) • State and local government (0.9%)
Evaluating Investment Risk • Credit risk Default risk: The possibility that the issuer will fail to meet its obligations under the indenture. While the bond market views default as the lack of timely payment of interest and principal, technical default may occur due to the issuer’s violation of other terms of the indenture. Downgrade risk: the risk that a bond is reclassified as a riskier security by a credit rating agency. When an issue is downgraded, the yield adjusts immediately to reflect the new rating.
2. Reinvestment risk When bond investors receive coupon payments, they bear the risk of reinvesting them at a rate of return or yield that is lower then the promised yield on the bond. This is known as reinvestment risk. The risk is present to a greater extent for those investors who depend on a bond’s coupon for most of their return. Reinvestment risk becomes more problematic with longer time horizons and when the current coupons being reinvested are relatively larger. Reinvestment is minimized with low or zero-coupon bond issues or when time horizons are short.
Call risk Bonds that can be redeemed by the borrowing firm prior to maturity. Call deferment period must expire. Also, bond’s price must be greater than or equal to the call price. Call risk related to reinvestment risk, as bonds are typically called during low interest rate periods. Call premium paid as compensation for reinvestment risk.
3. Liquidity risk It represents the likelihood that an investor will be unable to sell the security quickly and at a fair price. If the price fluctuates widely from transaction to transaction in the absence of interest rate and other changes, the security is said to trade in a market that is not liquid. Quantitatively, liquidity risk can be estimated through the Bid-ask spread. High spreads signal an illiquid market. Investors like liquid markets so that they can buy and sell securities quickly and at a fair price.
4. Yield curve risk A bond is made up of several coupon payments over its term. Each coupon payment can be viewed as a separate zero coupon bond. A different discount rate or yield applies for each cash flow payment date. Usually these individual discount rates do not change by the same amount. Shifts in the yield curve of any kind are of concern to bond investors and present a source of uncertainty. The risk associated with the yield curve is known as yield curve risk.
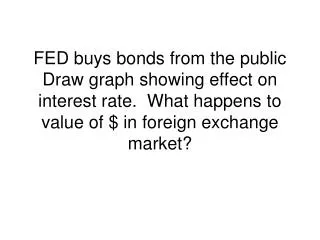
The U.S. Treasury Yield Curve When the yields on different Treasuries are plotted against their corresponding maturities, the resulting graph is known as the Treasury yield curve. U.S. Treasuries are used as a benchmark for computing yields on risky bonds. For a given maturity, a risk premium is added to the corresponding maturity Treasury security to arrive at the yield for a risky bond.
Under the normal economic conditions, this curve is upward sloping and is also called the normal yield curve. An inverted or downward sloping yield curve (i.e. shorter term interest rates exceeding longer term interest rates) is sometimes observed during economic contractions.
The term structure of interest rates is a graphic representation of yields to maturity versus time until maturity using zero-coupon Treasury strips instead of Treasury coupon securities as a basis for comparison. Treasury strips are created by investment bakers who strip off payments and sell them separately from the rest of the bond. This process creates a series of “zero coupon” securities. Zeros do not suffer from reinvestment rate risk since there is no cash flow until maturity. This method provides a better relationship between yields and different maturities.
Yield spread Although the yield spread has been defined as the difference between the yield on a non-treasury security and a benchmark Treasury security of the same maturity, it can also be defined for any two bonds, even if both are non-treasury issues. Yield spread = yield on bond 1 of maturity t – yield on bond 2 of maturity t
There are three ways in which yield spread can be quantified. • Absolute yield spread • Relative yield spread This quantifies the absolute yield spread as a percentage of the reference yield c. Yield ratio = yield on bond 1 / yield on bond 2 = relative yield spread + 1
Consider two bonds X and Y. Their respective yields are 6.5% and 6.75%. Using bond X as the reference bond, compute the absolute yield spread, the relative yield spread and the yield ratio. Absolute yield spread = 6.75% -6.5% = 0.25% or 25 basis points Relative yield spread = 0.25%/0.65% = 0.038 Yield ratio = 6.75% / 6.5% = 1.038 = 0.038 +1
Absolute yield spread may stay the same even if interest rates are rising or falling. This could be misleading, since as a percentage of the benchmark rate, the spread is declining. This effect can only be captured by the relative yield spread or the yield ratio. As verification of this, suppose the absolute spread stayed constant at 25 basis points, but the reference rate rose to 7.5%. The relative spread would fall to 25/750 = 0.0333.
Theoretical spot rates The use of a single discount factor (i.e. YTM) to value all bond cash flows assumes that interest rates do not vary with term to maturity of the cash flow. In practice, this is usually not the case - interest rates exhibit a term structure, meaning that they vary according to time to receipt of the cash flow. Consequently, YTM is really an approximation or weighted average of a set of spot rates (a spot rate is an interest rate used to discount a single cash flow to be received in the future).
Forward rates Spot interest rates are the result of market participant’s tolerance for risk and their collective view regarding he future path of interest rates. If we assume that these results are purely a function of expectations (called the expectations theory of the term structure of interest rates) we can use spot rates to estimate the market’s consensus on future interest rates. Based on the expectations theory, investors earn the same return regardless of their holding period. So, investor would earn the same amount by either purchasing a two-year bond and holding it for two years or purchasing a one-year bond now and another one-year bond next year.
e.g) Suppose that you have a two-year time horizon and are offered the choice between locking in a 2-year spot rate of 8.167 percent or investing at the 1-year spot rate of 4% and rolling over your investment at the end of the year into another 1-year security.
5. Price Risk/Interest Rate Risk Duration • Modified duration • Using modified duration to estimate a price change • Effective duration • Portfolio duration • Convexity • Estimating the convexity effect
Investment strategies • Passive investment strategies Space-maturity approach (or ladder approach) Spread available investment funds evenly across a specified number of periods within the bank’s investment horizon. Simple and low transactions costs, but passive with respect to interest rate conditions and liquidity is sacrificed to some extent.
Split-maturity approach (or barbell approach) Greater quantities of short-term and long-term securities are held. This strategy balances liquidity and higher income. Can adapt to front-end loaded and back-end loaded approaches.
Investment strategies • Passive investment strategies Ladder Approach $10 $10 $10 $10 $10 Barbell Approach $20 $20 $10 1 yr 2 yrs 3 yrs 4 yrs 5 yrs Maturities of Securities
10.16 Why might the split-maturity approach to investment management be preferred to the spaced-maturity approach? ANSWER: The spaced-maturity approach evenly spreads the investments of the bank over time into different maturity ranges. This approach to investment management sacrifices higher yields on longer-term securities as well as liquidity in terms of holding shorter-term liquid securities. The split-maturity approach overcomes these drawbacks by allocating larger proportions of the investment portfolio to both shorter-term and longer-term securities. This balances both earnings and liquidity goals of the bank.
Investment strategies • Aggressive investment strategies • Yield curve strategies • "Playing the yield curve" involves changing the maturity structure of the investment portfolio as interest rates change. • When interest rate levels are relatively low, the bank will purchase shorter-term securities. These securities are gradually rolled over into higher-yielding securities as interest rates rise in the future.
When interest rate levels are peaking out, maturing securities are rolled over into longer-term securities to lock in high yields as well as to possibly earn a sizable capital gain as interest rates fall in the near future.
Riding the yield curve -- assumes that the yield curve will not move in the near future. Example: assume that the yield curve is upward sloped. Buy securities and hold them so that their maturity decreases and (due to the shape of the yield curve) their yields decline (prices rise). Sell for a capital gain.