Download
1 / 43
440 likes | 687 Vues
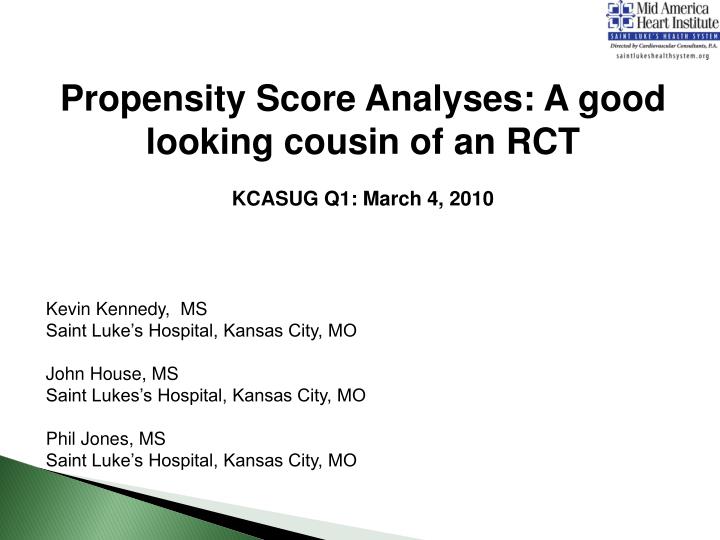
Propensity Score Analyses: A good looking cousin of an RCT KCASUG Q1: March 4, 2010 . Kevin Kennedy, MS Saint Luke’s Hospital, Kansas City, MO John House, MS Saint Lukes’s Hospital, Kansas City, MO Phil Jones, MS Saint Luke’s Hospital, Kansas City, MO. Motivation.

E N D
Propensity Score Analyses: A good looking cousin of an RCT KCASUG Q1: March 4, 2010 Kevin Kennedy, MS Saint Luke’s Hospital, Kansas City, MO John House, MS Saint Lukes’s Hospital, Kansas City, MO Phil Jones, MS Saint Luke’s Hospital, Kansas City, MO
Motivation • Estimating Treatment effect is important! • Is Drug “A” advantageous to Placebo? • Do same sex classes increase academic performance? • Do Titanium golf clubs increase distance of drives? • Designing ways to answer these questions should be: • Ethical • Practical • Cost Effective
The Gold Standard • Randomized Control Trials • Randomization of subjects to treatment groups (essentially coin flip determines group) • On average all subject characteristics will be balanced between groups
Benefits of a RCT • A pure link between Treatment and Outcome • Random allocation of subjects removes the possibility of a third factor being associated with treatment and outcome • Can blind subjects and researchers to treatment allocation
Potential Caveats with an RCT • Ethical Issues: • Not assigning subjects to a treatment generally thought to improve outcomes is often thought unethical • Practical Issues: • Problems with recruitment of subjects • Consenting to “alternatives”, and substantial ‘drop out’ • Cost and Time Issues: • Enrolling subjects, training staff, designing trial, treatment • May be “too” controlled • Specific subject criteria and treatment use • Population may not represent the “real world” experience Spaar A, Frey M, Turk A, Karrer W, Puhan MA. Recruitment barriers in a randomized controlled trial from the physicians' perspective: a postal survey. BMC Med Res Methodol. 2009 Mar 2;9:14
So…what now? • Observational data is popular • Treatment is not given due to randomization, only observed • Unfortunately…Subject characteristics will likely not be balanced
So…what now? • Need to account for the differences between treatment and control • Common in modeling to “adjust” away differences between groups • However, sample size constraints restrict the # of variables to adjust for • Solution: Propensity Scores
Propensity Score Outline • Introduction • How to use the score • Matching • Stratifying • Accessing Balance • Standardized Difference • Propensity Scores Using SAS • Concluding remarks • Other uses • Issues with publications
Introduction • Definition: • Propensity score (PS): the conditional probability of being treated given the individual’s covariates • Notation: • Estimating Propensity Score can be done with the common logistic regression model predicting treatment on selected covariates needing balanced • Will be used to balance characteristics between groups
Introduction Here we would develop a PS for being in the treatment group conditioned on: age, gender, diabetes history, and heart failure
Introduction-why important? • Important: For a specific value of the PS the difference between treatment and control is an unbiased estimate of the average treatment effect at that PS (Rosenbaum & Rubin, 1983; Theorem 4) • “Quasi-Randomized” experiment • Take 2 subjects (one from treatment and other control) with the same PS then you could “imagine” these 2 subjects were “randomly” assigned to each group. (since they are equally likely to be treated. Rosenbaum PR, Rubin DB. The central role of the propensity score in observational studies for causal effects. Biometrika. 1983;70:41–55.
Introduction • It’s not just a side analysis anymore……
Ways to use the PS • Common strategies include: • Matching • Match treatment and controls on PS • Stratification • Keep all subjects but analyze in Strata (usually quintiles of PS) • Regression adjustment
Matching • Most common use of PS analyses. • Since the PS is a single scalar quantity Matching is comparatively easier (as opposed to matching on: age, gender, history, etc…) • Matching 1 Control to 1 Treatment makes for an easily understood analyses • Common to match on the Logit of the PS since it is approximately normal
Matching • Nearest Neighbor matching (w/o replacement) • Randomly Order Treated and Control Subjects • Take the first treated subject and find the Control with the closest Propensity Score. Remove both from list • Move to the second Treated subject and find control with closest PS……continue until you run out of treated patients • This will create a 1:1 match of treated and control patients • Note: methods exist for 1:many matches also
Matching • Problem: The “Nearest” neighbor may not be that “Near” • May want to enforce a caliper width for acceptable matches • E.g. if there is no control within the ‘caliper’ of a case then no match occurs and case will be removed • Common in Literature to use: .2*stddev[L(x)] as the caliper • For a matching macro see: mayoresearch.mayo.edu/biostat/upload/gmatch.sas
Matching: Ideal Scenario • Before Match • After Match:
Stratification • Matching will inevitably result in a smaller dataset • Stratifying analyses on PS will keep all data. • Create the PS • Cut the PS into equal groups (Quartile, Quintiles) • (Rosenbaum & Rubin, 1983) claim quintile strata will remove 90% of bias • Conduct the analyses within these strata
Example • Comparison of Angiography (vs not) in elderly patients with Chronic Kidney Disease (CKD) • Propensity score for receiving an Angio • Based on Demographics, History, and Hospital Characteristics Chertow GM, Normand SL, McNeil BJ. "Renalism": inappropriately low rates of coronary angiography in elderly individuals with renal insufficiency. J Am Soc Nephrol. 2004 Sep;15(9):2462-8
Covariate Adjustment • This use would be the least recommended. • Do a model for PS, and then use that PS in a model as an adjustment when evaluating association between treatment and outcome • Advantage over normal covariate adjustment • Simpler final model • Can have many more covariates in the PS model
Assessing Balance • Remember: the main purpose of a PS is to balance characteristics between treated and controls…so how do we show success? • P-values • Function of Sample Size • May be misleading for Stratification or 1:many match • Standardized Differences • Not a function of Sample Size • Can be used for Stratification and 1:many matches
Standardized Differences • Formula: Continuous Variables • Formula: Dichotomous Variables • For Stratified analyses: compute d in each strata and take average
Standardized Differences • Sample Calculations for a 1:1 match: • Before Match • After Match
Standardized Differences • What value constitutes balance? • Peter Austin Commonly states values less than 10 constitute balance between groups • The closer to ‘0’ then more balanced
Propensity Analysis (Matching) Using SAS • Simulated Data • Data specifics • N=5000 (~1000 Group1, ~4000 Group2)
Example: Create PS proclogistic data=dataset descending; model group1= age gender diabetes {+others}; output out=pred p=pred xbeta=logit; run; Predicted probabilities of being in group 1 On Logit scale
Example: Define Caliper procmeans data=pred stddev; var logit; output out=lstd; run; data _null_; set lstd; if _stat_='STD' THEN do; call symputx('std',logit/5); end; run; Creating “caliper” of .2*stddev(logit)
Example: Perform Match %gmatch(data=pred, group=group1, id=id, mvars=logit, wts=1 , dmaxk=&std, ncontls=1, seedca=987896, seedco=425632, out=match); mayoresearch.mayo.edu/biostat/upload/gmatch.sas
Example: Assess Balance • Original Data • %std_diff(data=fulldata, group=group1, continuous=age {+others}, binary=male diabetes {+others}, out=before) • Matched Data • %std_diff(data=matched_data, group=group1, continuous=age {+others}, binary=male diabetes {+others}, out=after) • Combine data after; set after(rename=(stddiff=after_stddiff)); run; procsql; create table both as select * from before as a join after as b on a.variable=b.variable ; quit;
Example: Assess Balance procgplot data=both; title 'Standardized difference plot'; plot label*StdDiff=1 label*after_stddiff=2/overlay vaxis=axis1 haxis=axis2 href=10 legend=legend1 AUTOVREF chref=black lhref=3; run; quit;
Format macro Sort by stddiff before match procsort data=both;by stddiff;run; /*attach formats to variables*/ %macro doformat(data=); data &data; set &data; count+1; run; proc sql; select label into :label separated by '*' from &data; quit; %let numvar=%words(&label,delim=%str(*)); proc format; value fmt %do i=1 %to &numvar ; &i=%qscan(&var,&i,*) %end;; run; data &data; set &data; format count fmt.; run; %mend; %doformat(data=both); Counter Variable Read in Label names into &label Count # of Variables Format (i) counter with (i) label
Assessing Balance proc gplot data=both; title 'Standardized difference plot'; plot count*StdDiff=1 count*afterstddiff=2/overlay vaxis=axis1 haxis=axis2 href=10 legend=legend1 AUTOVREF chref=black lhref=3; run; quit;
Standardized difference plot stemi emergency elective age currentsmoke nstemi apr_mort cardiogenic_shock prior_PCI self_pay apr_sev hypertension hyperlipidemia diabetes race_white male chronic_kidney_dis formersmoke race_black prior_MI anemia PVD oth_aterialdisease rheumatic_HD CVD heartfailure stroke renal_insufficiency tia COPD obese dialysis otherheart_disease Before Match renal_failure After Match underweight 0 10 20 30 40 50 60 70 Standardized Difference
Now What? • Variable Standardized differences are <10, indicating balance • Now we can see if group membership has an impact on our outcome • Caution: this is matched data so statistically we need to account for this • Paired t-tests, McNemars Test, Conditional Logistic Regression, Stratified Proportional Hazard Regression
Other Uses… • A way to show just how different 2 groups are… Distribution of Propensity Scores 1.0 0.9 0.8 0.7 0.6 Probability of Group 2 0.5 0.4 0.3 0.2 0.1 0 Group 1 Group 2
Probability Group 2 Group 1 Group 2
Concluding Remarks • If you want more information: Search for Ralph D’Agostino Jr. (Wake Forest) and Peter Austin (Univ of Toronto) • Introductory Read: • D’Agostino JR: Tutorial in Biostatistics: Propensity Score Methods for Bias Reduction in the comparison of treatment to a non-randomized control group. Statist. Med 17 (1998), 2265-2281 • 1:Many Matching • Austin P. Assessing balance in measured baseline covariates when using many-to-one matching on the propensity score. Pharmacoepidemiology and drug safety (2008) 17: 1218-1225
Concluding Remarks…things to avoid • Austin (2008) performed a literature review and found many propensity score matching papers were done incorrectly • 47 Articles reviewed from medical literature which did Propensity Score Matching • Only 2 studies used Standardized Differences to access match (most relied on p-values) • Only 13 used correct statistical methods for matched data • See paper for the common errors • Only 2 studies assessed balance correctly and used correct statistical methods Austin PC. A critical appraisal of propensity-score matching in the medical literature between 1996 and 2003. Stat Med. 2008 May 30;27(12):2037-49
Concluding Remarks…things to avoid • Austin’s Recommendations • Strategy for creating pairings should be specifically stated with appropriate statistical citation • The distribution of baseline characteristics between treated and control should be described • Differences in distributions should be assessed with methods not influenced by sample size • Use appropriate statistical methods to account for match • McNemar’s Test for Binary data • Use of strata statement in proc logistic or phreg
What have we learned…if anything • RCT may be the gold standard but Propensity Scores are their attractive cousin • Using PS can remove a lot of bias in determining treatment effect • You can: Match, stratify, or adjust for the PS • Use the standardized difference to determine balance (unaffected by sample size)
Contact Information Name: Kevin Kennedy Company: Mid America Heart Institute: St. Luke’s Hospital Address: 4401 Wornall Rd, Kansas City, MO Email: kfk3388@gmail.com or kfkennedy@saint-lukes.org SAS and all other SAS Institute Inc. product or service names are registered trademarks or trademarks of SAS Institute Inc. in the USA and other countries. ® indicates USA registration. Other brand and product names are trademarks of their respective companies.