Download
1 / 22
220 likes | 331 Vues
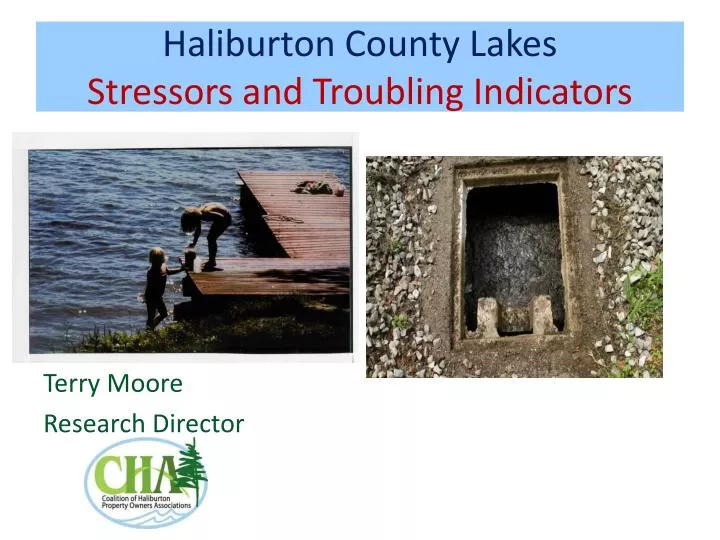
Haliburton County Lakes Stressors and Troubling Indicators. Terry Moore Research Director. Two Imperatives. The health of Haliburton's environment and its economy and property values are connected and dependent on the reality , not merely the image, of outstanding water quality.

E N D
Haliburton County LakesStressors and Troubling Indicators Terry Moore Research Director
Two Imperatives • The health of Haliburton's environment and its economy and property values are connected and dependent on the reality, not merely the image, of outstanding water quality. • Water quality protection and maintenance is "job one" for all of us
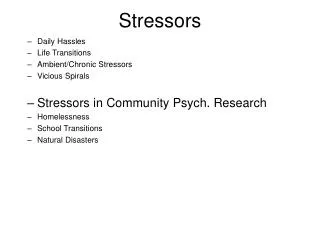
Ignorance was Bliss For years lake associations Did secchi disk and phosphorous testing While not ideal there was not a lot of change But indicators were troubling Weed growth ↑ Fish populations ↓ Foul odours ↑ Algal blooms ↑
Response • Set out to learn & share more • Numerous training courses • Expert speakers • Did more testing • Dissolved Oxygen • Calcium • Invasive species • Coliform & E Coli • Investigated actions that could be taken to improve the situation
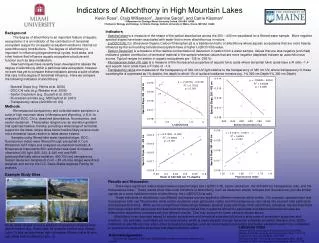
Multiple Stressors Phosphorous + Calcium declines Runoff ↓ 25% Invasive species ↑ Open water season length ↑ Temperatures ↑ Dr Norman Yan - MOE
Phosphorus and Calcium LevelsStatic Phosphorus levels are driving excessive nutrient loading;Declining Calcium levels are threatening algae eating organisms such as the Daphnia
Ca decline in 37 Muskoka/Haliburton lakes* 4.5 1:1 4.0 Median change = -12% 3.5 3.0 2.5 2.0 1.5 1.0 0.5 0.0 0.0 0.5 1.0 1.5 2.0 2.5 3.0 3.5 4.0 4.5 Ca (mg/L) in the 1980's *Michelle Palmer’s PhD vs. old DESC data
The “little living lawnmower” Daphnia*It’s ~3% Ca * Photo by D. Taylor, U of Buffalo
Algal blooms Are Increasing 50 other golden-brown algae green algae 40 blue-green algae 30 20 10 0 1994 1996 1998 2000 2002 2004 2006 2008 2010 2012 total, green & blue-green algae bloom reports from 1994-2012 (p < 0.001) For more information see: Winter et al. (2011) Algal blooms in Ontario, Canada: Increases in reports since 1994. Lakes & Reservoir Management, 27:105-112. 10
Trout = Aquatic Canaries in Coal Mines • Trout are very sensitive to Dissolved Oxygen (DO) Levels • Cannot survive in an environment below 7mg/l of DO • MOE and MNR test Cold Water Trout Lakes (CWTL) for DO • CWTL with DO levels below 7mg/l are considered “at capacity” and new lot creation is embargoed
Haliburton Trout Lakes “At Capacity” Status • Number of cold water trout lakes (CWTLs) in Haliburton County (HC) = 105; * number "at capacity" = 50 (or 48%); * number "not at capacity" = 43 (or 41%); * number not rated = 12 (or 11%) • If you take out the 12 "not rated" lakes the following results: * number of rated lakes at capacity = 50/93 or 54%; * number of rated lakes "not at capacity" = 43/93 or 46%
Dead Zones in Haliburton LakesTiming, Size and DurationAll Affected by Human Activity
Global Warming is altering the rules of the game Changes to the hydrological cycle across Eastern North America • Less precipitation as snow and smaller snow pack • Earlier snow melt • Later ice over and earlier ice out • More rain in spring and fall • Less rain in summer • More extreme weather events including drought and heavy precipitation • More Challenges for the TSW
What is Causing Water Quality Decline on our Lakes? Best Answer = Combined Impact of Multiple Stressors • Septic Systems • Shoreline De Naturalization and • Climate Change
Who Will Look After Our Lakes? • All levels and stripes of govt are cutting back • MNR • MOE • Federal Government • More and more will fall to underfunded and under staffed Lake Associations
Key Factors Under Individual Control • Septic Systems • Every system pollutes • 1 in 4 systems are not working properly • Un Natural Shorelines
Most Important Individual Actions • Healthy Septic Systems and Practices Time and Bacteria • Time by minimizing water use ( 1 drop in = 1 drop out) • Bacteria by eliminating all bacteria killers + • Tip sheet available Shoreline Naturalization • Replace this with next slide
Encourage Collective Action • Tell Political Leaders to get serious about Climate Change and other Lake Stressors • Support Mandatory Septic Re-Inspection and Remedial Action • Support Shoreline Protection and Restoration Initiatives • Support and Get Involved in Lake Association Water Quality Initiatives