Download
1 / 15
260 likes | 711 Vues
Risk-Adjusted Performance Measurement. There are many types of performance measures but most measures now adjust for portfolio or asset risk or compare the performance between similar portfolios . The two general types of risk-adjusted measures are: Ratios of mean return to risk

E N D
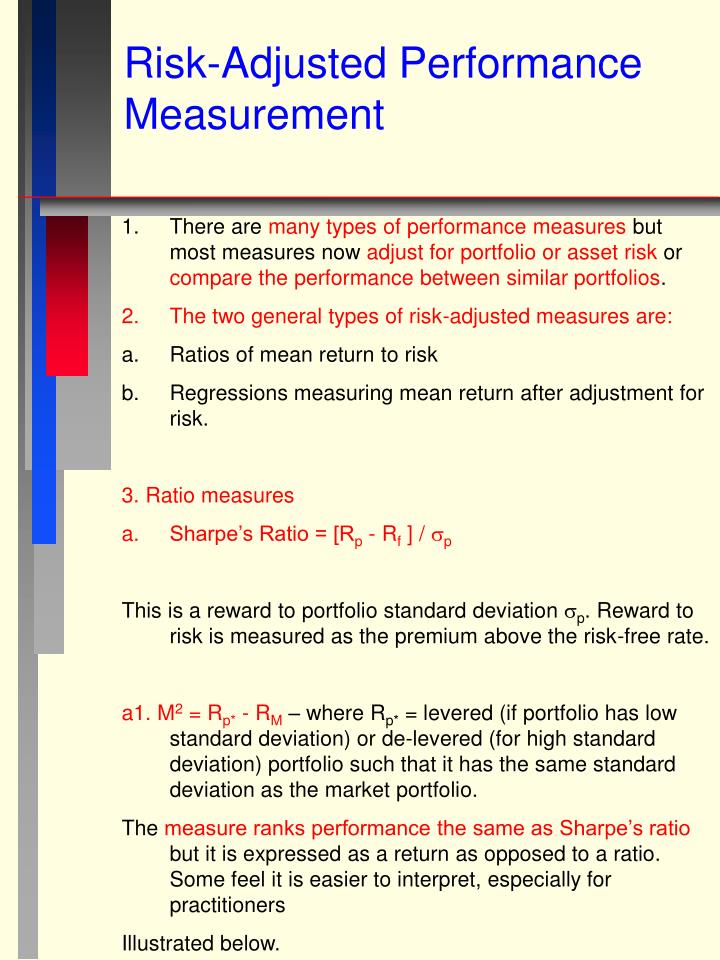
Risk-Adjusted Performance Measurement • There are many types of performance measures but most measures now adjust for portfolio or asset risk or compare the performance between similar portfolios. • The two general types of risk-adjusted measures are: • Ratios of mean return to risk • Regressions measuring mean return after adjustment for risk. • 3. Ratio measures • Sharpe’s Ratio = [Rp - Rf ] / p • This is a reward to portfolio standard deviation p. Reward to risk is measured as the premium above the risk-free rate. • a1. M2 = Rp* - RM – where Rp* = levered (if portfolio has low standard deviation) or de-levered (for high standard deviation) portfolio such that it has the same standard deviation as the market portfolio. • The measure ranks performance the same as Sharpe’s ratio but it is expressed as a return as opposed to a ratio. Some feel it is easier to interpret, especially for practitioners • Illustrated below.
Here, portfolio P* has a negative M2 measure and a Sharpe ratio below that of the market M (its CAL is below the CML). • Treynor’s Ratio = [Rp - Rf ] / p • Similar to Sharpe but only uses systematic risk, . That is, put on the x-axis in the graph above and the slope of the line would be the Treynor measure. The comparison line would be the SML instead of the CML.
c. Appraisal ratio = / e • Where is a portfolio return adjusted for systematic risk (see next section) and e is the standard deviation of unsystematic risk (residual). • This measure gives a return per unit of extra risk one absorbs by not holding the market portfolio. • If the extra risk will be diversified away because the portfolio or asset will be added to a diversified portfolio, then this measure can be misleading. • Alpha Measures - use regression • 1. Jensen’s model based on CAPM -> Rp = Rf + p[Rm -Rf] • - Run the regression [Rp - Rf ] = + p[Rm -Rf] + e • where the funds’ portfolio return is Rp, the risk-free return is Rf, the expected market return is Rm, alpha is , beta is B, and e is the regression error term. • 2. Treynor/Mazuy version of this model includes a squared term to account for nonlinear effects. • Run [Rp - Rf ] = + 1[Rm -Rf] + 2[Rm -Rf]2 + e • This approach handles the non-linearities that are caused by market timing. Other alpha-type performance models add other indexes to control for other systematic return factors.
Just as M2 can be seen as the distance between a portfolio’s return and the CML, alpha is the distance between the portfolio’s return and the SML. The graph assumes that the portfolio can be leveraged up or down so that any return along the lines containing P or Q can be reached. It suggests that alpha can be misleading when we compare alphas for portfolios with very different betas because the gap between the portfolio’s line and the SML increases as beta increases so two points on the same portfolio line will have different alphas even though the difference could be eliminated by leveraging one up or down. Nevertheless, alpha is probably the most common performance measure used because it can handle as many factors as one would like to include. A ratio measure works best for a single (market) factor.
3. Fama-French Model - adds small stock (SMB) and book-to-market factors (HML) to Jensen’s model. SMB is the difference in return between a portfolio of the smallest stocks and a portfolio of the largest stocks (net investment is zero). HML is the difference in return between a portfolio of high book value-to-market value stocks and a portfolio of low book value-to-market value stocks (net investment zero). [Rp - Rf ] = + 1[Rm -Rf] + 2[SMB] + 3[HML] + e 4. For the alpha models, one regresses the fund’s return minus the risk free rate on the factors. Significant positive (negative) performance is indicated if the intercept (the alpha coefficient) is positive (negative) and statistically significant (t-statistic greater than 1.65). Example: For Fidelity Value Fund [Rp1 - Rf ] = -0.11 + 0.88[Rm -Rf] basic CAPM (0.70) (21.7) [Rp1 - Rf ] = -0.15 +0.96[Rm -Rf] + 0.23[SMB] + 0.33[HML] (1.0) (23.5) (4.4) (5.1) Fama-French Model: Alpha = -0.15 with a t-statistic of 1.0 which means that performance is not statistically significant.
Example: Given the following data assess the performance of the UCONN fund. UCONN S&P500 Sharpe’s Measure -1.23 -0.92 M2 -7.56 0.00 Alpha -3.67 0.00 Beta 1.11 1.00 Treynor Measure -34.88 -13.32 Appraisal ratio -0.13 0.00 e 19 0.00 p 32 21
Performance Attribution • Rather than focus on risk-adjustment, some prefer to simply ascertain where a particular portfolio obtains its performance in comparison to a “bogey” portfolio. • Although this is often associated with practitioners, there are theoretical reasons to focus solely on total returns and their composition. • For example, it turns out that when there is asymmetry in information between the investor (observer of returns) and the investment manager, total returns may often be a better measure of performance. • Recall from the paper on unconditional mean variance portfolio optimization in the presence of conditioning information that when the manager knows he will be measured unconditionally, he will be “conservative” in his portfolio selection so that he makes sure that his performance looks good to the unconditional observer. • Here, “conservative” means that he does not take full advantage of his information because he is constrained by the observer who defines his performance. • The act of risk adjustment will usually be counterproductive in these cases because risk will be defined improperly. Risk would need to be defined conditional on the manager’s information but the information asymmetry makes this impossible. • As a result, total return is a reasonable performance measure.
5. A common performance attribution system decomposes performance into three components: a. Asset allocation – equity, bonds, money market b. industry selection – within each asset class c. Security selection – within each industry 6. Performance is defined as the return difference between the managed portfolio P, and the benchmark “bogey” B. Each asset class is defined by I, for example, airline bonds Return on P = Rp = i wpirpi Return on B = RB = i wBirBi The difference in returns is Rp - RB = i [wpirpi - wBirBi ] This can be further decomposed into an asset allocation part and an asset selection part as follows Rp - RB = i [wpirpi - wBirBi ] = i [(wpi – wBi)rBi + wpi(rpi - rBi )] The first term measures how the deviation from the benchmark’s asset weights affects the performance. The second term measures how security selectionwithin each asset class i, provides better or worse returns than the benchmark’s return on asset class i.
Example: Suppose we have the following data for UCONN: P Weight B Weight P Return B Return Bonds: Corporate .10 .20 3.0 4.0 Treasury .10 .20 2.0 3.0 Stocks: Small .30 .20 -12.0 -15.0 Large .20 .30 -8.0 -10.0 Money M .30 .10 1.0 1.0 How did the UCONN manager perform? What do you attribute his or her performance to, i.e., decompose the performance.
Christopherson, Ferson, and Glassman (1998) In footnote 6, they say that manager's alpha is a conditional function of the covariances of a managers portfolio asset weights (X) and market return Rm and residual return (u). To see this: All variables are conditional on the information set Z. I am using vectors so there are no i subscripts. r is the return vector on the assets in the portfolio. b is the asset beta. As in the footnote, the asset returns follow the return model r = bRm + u So the portfolio return is rX = bRmX + uX Take expectations wrt. Z E[rX] = E[bRmX] + E[uX] If the manager has more information than Z, then X is random so you cannot take the expectation through a product of two random variables so use E(XY) = Cov(X,Y) + E(X)E(Y) then E[rX] = Cov(r,X) + E(r)E(X) Also note that the manager’s expected return is random because he has more information than Z so we substitute for r using r = bRm + u, take iterated expectations, and use the fact that E(u) = 0. E[rX] = Cov((bRm + u),X) + E(bRm + u)E(X) EE[rX]= E[Cov((bRm + u),X)] + E(bRm)E(X)
EE[rX]= E[Cov((bRm, X) + Cov(u,X)] + bE(Rm)E(X) First note that bE(Rm)E(X) is the unconditional portfolio return, i.e., the return one could expect if you just held the manager’s average portfolio weights, E(X) and never changed them. You should just get the market related returns from those weighted holdings, given each holding’s beta b. Therefore, the covariances that are left over should have values of zero unless the manager changes his holdings over time in response to his private information (which includes more than Z). If the manager has extra information about the market return, then he increases (decreases) the weights on low (high) beta stocks when his information tells him that the market return will be low. He does the reverse if his information tells him that the market return will be high. Therefore, Cov(bRm,X) > 0. Similarly, he reweights his portfolio if he has extra firm-specific information by increasing (decreasing) the weight on stocks that his information tells him will have unusually high (low) firm-specific returns. Therefore, Cov(u,X) > 0.
6. Newer methods of performance measurement try to determine whether an asset manager tends to buy assets whose prices go up more (down less) than the assets they sell. This is a covariance performance measure 1. Graham-Harvey, Grinblatt-Titman Measure Cov(wi, ri) = i [ E(wiri) - E(wi) E(ri) ] This is the covariance between the portfolio weights of each asset i, and the return of asset i. The first term in the square brackets can be thought of as the manager’s weighted expected return for an asset in his portfolio given his weight selection (based upon his information). The second term can be though of as the expected return for a bogey portfoliowhere the weights are not actively changed (covariance between weights and returns is zero which implies 0= [E(wr) – E(w)E(r)] so E(wr) = E(w)E(r)). This can be rewritten as an “event-study” measure as follows Cov(wi, ri) = i E[ (wi(ri - E(ri)) ] In an event study, we calculate the residual return as (ri - E(ri)) and find an average residual where all weights equal 1/n or sometimes we weight by market value of each security. The asset’s expected return is given by a model like the CAPM. The “portfolio change” measure can be written as Cov(wi, ri) = i E[ (wi - E(wi))ri ] With T time series observations on a manager’s asset weights and returns, this measure can be estimated as follows
Cov(wi, ri) = i t [(wi,t – wi,t-1))rit ]/T This is positive if the manager increases (decreases) his weights between times t-1 and t on assets that have large (small) returns in period t on average over all assets and time periods. Conversely, the covariance is negative if the manager changes asset weights inappropriately. If the manager holds a passive (index) portfolio, the weights don’t change actively so performance is zero. 2. Admati and Ross’s measure – I use this (# shares of stock i)t = b0 + b1(stock i price + dividend)t+1 + b2(stock i price)t + e This measure controls for stock price at time t (it is conditioned on the information reflected in the market price). Performance is positive if b1 is positive and significant. Here again, the regression feature of this approach allows one to make adjustments to the model. For example, I get # shares t = 4.71 + 0.04(stock price + dividend)t+1 – 0.05(stock price + dividend)t+1 (Sale Dummy) + 0.06(stock i price)t - 0.04(stock i price)t(Sale Dummy) All estimates have t-statistics greater than 2.3.
When to Use Each Measure • When the managed portfolio represents an investor’s entire wealth. • Use the Sharpe Measure because the investor bears the full standard deviation risk. • 2. When the managed portfolio is to be mixed with a market portfolio. • Use the appraisal ratio because it represents the improvement in the Sharpe ratio for the overall portfolio due to the addition of the managed portfolio. • 3. When the managed portfolio is combined with many other portfolios into a large investment fund. • Use the Treynor measure because the risk of each portfolio in the group (i.e., the marginal risk it adds to the large fund) can be approximated by its beta. Each portfolio’s unsystematic risk will be diversified away when it is grouped into the large fund.
4. If a time series of data on the holdings in the portfolio is available. Use the Admati and Ross measure (or Grinblatt-Titman) because it does not require the assumption that the CAPM (or any other pricing model) holds. Also, it typically offers more statistical power than the other measures. Indeed, it may take 10-30 years of data in order to obtain enough statistical power to determine whether a particular portfolio’s alpha or Sharpe ratio is statistically significant. This is because the standard errors of these measures is relatively large. The advantage of the Admati and Ross measure is that every portfolio holding offers an observation so that the large number of potential observations drives down the standard errors of the performance measure.