Download
1 / 1
10 likes | 111 Vues
SUPPLEMENTAL FIGURE S1. Fig. S1. Validation of accelerated expression kinetics of c-MYC by quantitative real-time RT-PCR. Real-time PCR analysis was performed as previously described [10] using RNA from an independent

E N D
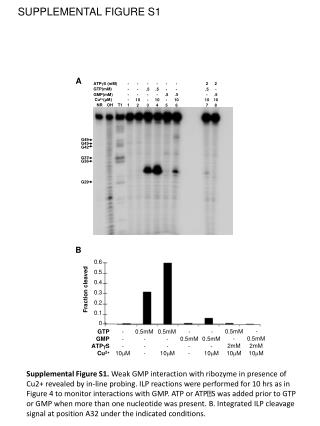
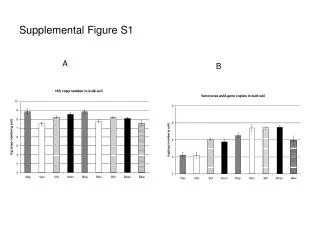
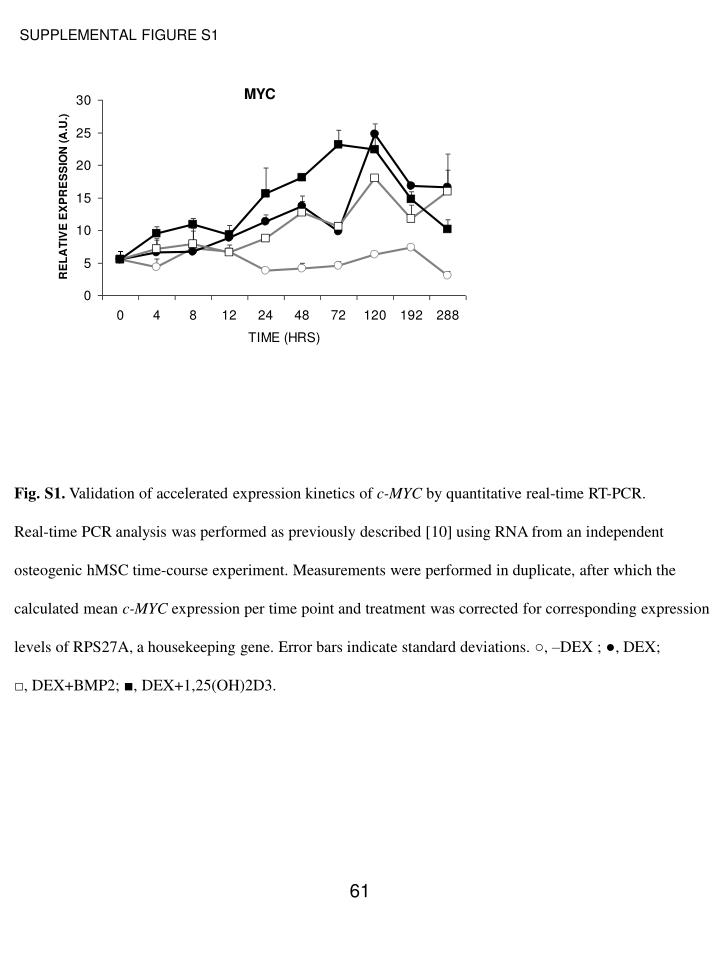
SUPPLEMENTAL FIGURE S1 Fig. S1. Validation of accelerated expression kinetics of c-MYC by quantitative real-time RT-PCR. Real-time PCR analysis was performed as previously described [10] using RNA from an independent osteogenic hMSC time-course experiment. Measurements were performed in duplicate, after which the calculated mean c-MYC expression per time point and treatment was corrected for corresponding expression levels of RPS27A, a housekeeping gene. Error bars indicate standard deviations. ○, –DEX ; ●, DEX; □, DEX+BMP2; ■, DEX+1,25(OH)2D3. 61