Download
1 / 25
250 likes | 615 Vues
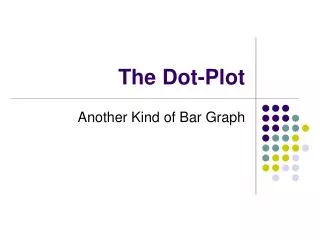
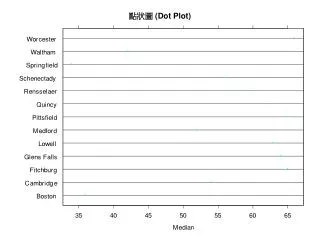
Dot Plot. Dot Plot. Goal. We will take two nucleotide base strings and look for common patterns – stretches where the bases match. GAATTCATACCAGATCACCGAAAACTGTCCTCCAAATGTGTCCCCCTCACACTCCCAAAT TCGCGGGCTTCTGCTCTTAGACCACTCTACCCTATTCCCCACACTCACCGGAGCCAAAGC.

E N D
Goal • We will take two nucleotide base strings and look for common patterns – stretches where the bases match. • GAATTCATACCAGATCACCGAAAACTGTCCTCCAAATGTGTCCCCCTCACACTCCCAAAT • TCGCGGGCTTCTGCTCTTAGACCACTCTACCCTATTCCCCACACTCACCGGAGCCAAAGC
Anatomy of the formula (Part 1) • =IF(MID($B$1,E$3,$B$4)=MID($B$2,$D4,$B$4),1,0) • Recall MID takes a string $B$1 is the first base sequence and $B$2 is the second base sequence • Then MID takes a part of the string beginning at the “second argument”
Anatomy of the formula (Part 2) • =IF(MID($B$1,E$3,$B$4)=MID($B$2,$D4,$B$4),1,0) • The starting point varies. • E$3 stays in the third row as the formula is copied and uses the various numbers 1 through 60 set up in row 3. • $D4 stays in column D and uses the various numbers 1 through 60 set up in column D.
Anatomy of the formula (Part 3) • The third argument is the length of the match we seek. They are both the same length. • If the two “substrings” (base mini sequences) match, output a 1, otherwise a zero. • Then copy the formula throughout the grid.
We are we looking for? • In dot plots, one looks for dots (for us colored cells) along diagonals. • A “long” diagonal means that the mini base sequences within the longer sequence match.
Question • What is the longest match between these two sequences?
Problem • We are looking for diagonal matches; however, increasing the length of the match only allows only one of the two diagonal types to survive.
New Sheet: Enter one string and also make column of descending numbers
Repeat the analysis looking for matches between one original and one reversed string
Question • What is the longest match between these one of the original sequences and one of the reversed sequences?