Download
1 / 50
620 likes | 928 Vues
ECONOMICS 5e. Michael Parkin. Output and Costs. Learning Objectives. Distinguish between the short-run and the long-run Explain the relationship between a firm’s output and labor employed in the short-run Explain the relationship between a firm’s output and costs in the short-run

E N D
ECONOMICS 5e Michael Parkin Output and Costs
Learning Objectives • Distinguish between the short-run and the long-run • Explain the relationship between a firm’s output and labor employed in the short-run • Explain the relationship between a firm’s output and costs in the short-run • Derive and explain a firm’s short-run cost curves
Learning Objectives (cont.) • Explain the relationship between a firm’s output and costs in the long-run • Derive and explain a firm’s long-run average cost curve
Learning Objectives • Distinguish between the short-run and the long-run • Explain the relationship between a firm’s output and labor employed in the short-run • Explain the relationship between a firm’s output and costs in the short-run • Derive and explain a firm’s short-run cost curves
Sidney’s Sweaters Inc. Throughout the chapter we are going to refer to Sidney’s Sweaters Inc., a producer of knitted sweaters. The firm is owned and operated by Sidney.
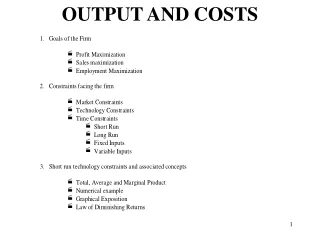
Decision Time Frames The Objective: Profit Maximization • All of the firm’s decisions are aimed at one overriding objective: maximum attainable profit. To study the relationship between a firm’s output decision and its costs, we distinguish two decision time frames: • The short-run • The long-run
Decision Time Frames The Short-Run and the Long-Run The short-run is a time frame in which the quantity of at least one input is fixed and the quantities of the other inputs can be varied. The long-run is a time frame in which the quantities of all inputs can be varied. A sunk cost is irrelevant to the firm’s decisions.
Decision Time Frames To increase output in the short-run, a firm must increase the quantity of labor employed. Total product is the total output produced. Marginal product is the increase in total product that result from a one-unit increase in an input. Average product is the total product divided by the quantity of inputs.
Learning Objectives • Distinguish between the short-run and the long-run • Explain the relationship between a firm’s output and labor employed in the short-run • Explain the relationship between a firm’s output and costs in the short-run • Derive and explain a firm’s short-run cost curves
Total Product, Marginal Product, and Average Product Total Marginal Average Labor product product product (workers (sweaters (sweaters per (sweaters per day) per day) additional worker) per worker) a 0 0 b 1 4 c 2 10 d 3 13 e 4 15 f 5 16
Total Product, Marginal Product, and Average Product Total Marginal Average Labor product product product (workers (sweaters (sweaters per (sweaters per day) per day) additional worker) per worker) a 0 0 b 1 4 c 2 10 d 3 13 e 4 15 f 5 16 4 6 3 2 1
Total Product, Marginal Product, and Average Product Total Marginal Average Labor product product product (workers (sweaters (sweaters per (sweaters per day) per day) additional worker) per worker) a 0 0 b 1 4 4.00 c 2 10 5.00 d 3 13 4.33 e 4 15 3.75 f 5 16 3.20 4 6 3 2 1
TP f e d c b a Total Product Curve 15 Unattainable Output (sweaters per day) 10 Attainable 5 0 1 2 3 4 5 Labor (workers per day)
Marginal Product Curve Marginal product is also measured by the slope of the total product curve. Increasing marginal returns occur when the marginal product of an additional worker exceeds the marginal product of the previous worker.
Marginal Product Curve Diminishing marginal returns Occur when the marginal product of an additional worker is less than the marginal product of the previous worker Law of diminishing returns As a firm uses more of a variable input, with a given quantity of fixed inputs, the marginal product of the variable input eventually diminishes
Marginal Product TP 15 6 d 13 Output (sweaters per day) Marginal product (sweaters per day per worker) 4 10 c 3 5 2 4 MP 0 1 23 4 5 0 1 23 4 5 Labor (workers per day) Labor (workers per day)
Average Product Curve What does the average product curve look like?
Maximum average product c c d e b f AP MP Average Product 6 Average product & Marginal product (sweaters per day per worker) 4.33 4 3 2 0 1 2 3 4 5 Labor (workers per day)
Learning Objectives • Distinguish between the short-run and the long-run • Explain the relationship between a firm’s output and labor employed in the short-run • Explain the relationship between a firm’s output and costs in the short-run • Derive and explain a firm’s short-run cost curves
Short-Run Cost Total cost (TC) is the cost of all productive resources used by a firm. Total fixed cost (TFC) is the cost of all the firm’s fixed inputs. Total variable cost (TVC) is the cost of all the firm’s variable inputs.
Short-Run Cost Total cost (TC) is the cost of all productive resources used by a firm. TC = TFC + TVC
Total Cost Curves Total Total fixed variable Total cost cost cost Labor Output (TFC) (TVC) (TC) (workers (sweaters per day) per day) (dollars per day) a 0 0 b 1 4 c 2 10 d 3 13 e 4 15 f 5 16
Total Cost Curves Total Total fixed variable Total cost cost cost Labor Output (TFC) (TVC) (TC) (workers (sweaters per day) per day) (dollars per day) a 0 0 25 b 1 4 25 c 2 10 25 d 3 13 25 e 4 15 25 f 5 16 25
Total Cost Curves Total Total fixed variable Total cost cost cost Labor Output (TFC) (TVC) (TC) (workers (sweaters per day) per day) (dollars per day) a 0 0 25 0 b 1 4 25 25 c 2 10 25 50 d 3 13 25 75 e 4 15 25 100 f 5 16 25 125
Total Cost Curves Total Total fixed variable Total cost cost cost Labor Output (TFC) (TVC) (TC) (workers (sweaters per day) per day) (dollars per day) a 0 0 25 0 25 b 1 4 25 25 50 c 2 10 25 50 75 d 3 13 25 75 100 e 4 15 25 100 125 f 5 16 25 125 150
TC TVC TFC Total Cost Curves TC = TFC + TVC 150 Cost (dollars per day) 100 50 0 5 10 15 Output (sweaters per day)
Marginal Cost Marginal cost is the increase in total cost that results from a one-unit increase in output. It equals the increase in total cost divided by the increase in output. Marginal costs decrease at low outputs because of the gains from specialization, but it eventually increases due to the law of diminishing returns.
Average Cost Average fixed cost (AFC) is total fixed cost per unit of output. Average variable cost (AVC) is total variable cost per unit of output. Average total cost (ATC) is total cost per unit of output.
TC TFC TVC = + Q Q Q Average Cost TC = TFC + TVC OR ATC = AFC + AVC
Marginal Cost and Average Costs Total Total Average Average fixed fixed Total Marginal fixed variable Total cost cost cost cost cost cost cost Labor Output (TFC) (TVC) (TC) (MC) (AFC) (AVC) (ATC) (workers (sweaters (dollars per per day) per day) (dollars per day) additional sweater) (dollars per sweater) a 0 0 25 0 25 b 1 4 25 25 50 c 2 10 25 50 75 d 3 13 25 75 100 e 4 15 25 100 125 f 5 16 25 125 150
Marginal Cost and Average Costs Total Total Average Average fixed fixed Total Marginal fixed variable Total cost cost cost cost cost cost cost Labor Output (TFC) (TVC) (TC) (MC) (AFC) (AVC) (ATC) (workers (sweaters (dollars per per day) per day) (dollars per day) additional sweater) (dollars per sweater) 0 1 2 3 4 5 0 25 50 75 100 125 a b c d e f 0 4 10 13 15 16 25 25 25 25 25 25 25 50 75 100 125 150 6.25 4.17 8.33 12.50 25.00
0 1 2 3 4 5 0 25 50 75 100 125 — 6.25 2.50 1.92 1.67 1.56 a b c d e f 0 4 10 13 15 16 25 25 25 25 25 25 25 50 75 100 125 150 6.25 4.17 8.33 12.50 25.00 Marginal Cost and Average Costs Total Total Average Average fixed fixed Total Marginal fixed variable Total cost cost cost cost cost cost cost Labor Output (TFC) (TVC) (TC) (MC) (AFC) (AVC) (ATC) (workers (sweaters (dollars per per day) per day) (dollars per day) additional sweater) (dollars per sweater)
Marginal Cost and Average Costs Total Total Average Average fixed fixed Total Marginal fixed variable Total cost cost cost cost cost cost cost Labor Output (TFC) (TVC) (TC) (MC) (AFC) (AVC) (ATC) (workers (sweaters (dollars per per day) per day) (dollars per day) additional sweater) (dollars per sweater) 0 1 2 3 4 5 0 25 50 75 100 125 — 6.25 2.50 1.92 1.67 1.56 a b c d e f 0 4 10 13 15 16 — 6.25 5.00 5.77 6.77 7.81 25 25 25 25 25 25 25 50 75 100 125 150 6.25 4.17 8.33 12.50 25.00
Marginal Cost and Average Costs Total Total Average Average fixed fixed Total Marginal fixed variable Total cost cost cost cost cost cost cost Labor Output (TFC) (TVC) (TC) (MC) (AFC) (AVC) (ATC) (workers (sweaters (dollars per per day) per day) (dollars per day) additional sweater) (dollars per sweater) 0 1 2 3 4 5 0 25 50 75 100 125 — 6.25 2.50 1.92 1.67 1.56 a b c d e f 0 4 10 13 15 16 — 6.25 5.00 5.77 6.77 7.81 25 25 25 25 25 25 25 50 75 100 125 150 — 12.50 7.50 7.69 8.33 9.38 6.25 4.17 8.33 12.50 25.00
MC ATC AVC AFC Marginal Cost and Average Costs ATC = AFC + AVC 15 Cost (dollars per sweater) 10 5 0 5 10 15 Output (sweaters per day)
Cost Curves and Product Curve How are the product curves related to the cost curves?
AP MP Product Curvesand Cost Curves 6 4 Average product and marginal product 2 2 Rising MP and falling MC: rising AP and falling AVC Falling MP and rising MC: rising AP and falling AVC Falling MP and rising MC: falling AP and rising AVC 01.52.0 Labor
MC AVC Maximum MP and minimum MC Maximum AP and minimum AVC Product Curvesand Cost Curves 12 9 Average product and marginal product 6 3 0 6.5 10 Labor
Learning Objectives (cont.) • Explain the relationship between a firm’s output and costs in the long run • Derive and explain a firm’s long-run average cost curve
Long-Run Cost Long-run cost • The cost of production when a firm uses the economically efficient quantities of labor and capital. Long-run costs are affected by the production function. Production function • The relationship between the maximum output attainable and the quantities of both labor an capital.
Learning Objectives (cont.) • Explain the relationship between a firm’s output and costs in the long run • Derive and explain a firm’s long-run average cost curve
The Production Function Output (sweaters per day) Labor Plant 1 Plant 2 Plant 3 Plant 4 1 4 10 13 15 2 10 15 18 21 3 13 18 22 24 4 15 20 24 26 5 16 21 25 27 Knitting machines (number) 1 2 3 4
The Long-Run Average Cost Curve The long-run average total cost curve is derived from the short-run average total cost curves. The segment of the short-run average total cost curves along which average total cost is the lowest make up the long-run average total cost curve.
Returns to Scale Returns to scale are the increases in output that result from increasing all inputs by the same percentage. Three possibilities: • Constant returns to scale • Increasing returns to scale • Decreasing returns to scale
Returns to Scale Constant returns to scale Technological conditions under which a given percentage increase in all the firm’s inputs results in the firm’s output increasing by thesamepercentage
Returns to Scale Increasing returns to scale Technological conditions under which a given percentage increase in all the firm’s inputs results in the firm’s output increasing by a larger percentage
Returns to Scale Decreasing returns to scale Technological conditions under which a given percentage increase in all the firm’s inputs results in the firm’s output increasing by a smaller percentage
Minimum Efficient Scale A firm’s minimum efficient scale is the smallest quantity of output at which long-run average cost reaches its lowest level.