Download
1 / 25
280 likes | 485 Vues
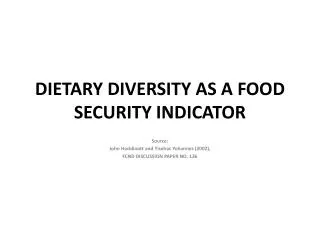
Dietary Diversity Scores Measurements. Srinivasulu Rajendran Centre for the Study of Regional Development (CSRD) Jawaharlal Nehru University (JNU) New Delhi India r.srinivasulu@gmail.com. Objective of the session.

E N D
Dietary Diversity Scores Measurements SrinivasuluRajendran Centre for the Study of Regional Development (CSRD) Jawaharlal Nehru University (JNU) New Delhi India r.srinivasulu@gmail.com
Objective of the session To measure dietary diversity scores that a household has consumed over the preceding 3 days or 24 hrs
How to calculate Dietary diversity scores and How to create other indicators of interest from dietary diversity data
The Household Dietary Diversity Score (HDDS) It is a simple COUNT OF FOOD GROUPS that a household or an individual has consumed over the preceding 24 hours (FAO Guidelines)
Detailed commodity groups available in “Guidelines for Measuring Household and Individual Dietary Diversity” FAO
IT IS VERY IMPORTANT TO UNDERSTAND THE TYPE OF COMMODITY INCULDES WHEN IT COOKED
How HDDS reflect to Food Security? HDDS is meant to reflect, in a snapshot form, the economic ability of a household to access a variety of foods . Source: FAO
Whereas, Individual Dietary Diversity Scores aim to reflect nutrient adequacy, BUT there some evidences Women Dietary Diversity Score (WDDS) also reflects Household Economic Access to Food Source: FAO
BUT Today we are focusing on
Data Sources The Household Dietary Diversity Score (HDDS) Anthropometric indictors Chronic Poverty Study - IFPRI Bangladesh Demographic and Health Survey (BDHS) - 2007
Reference Period • FAO uses a reference period of the previous 24 hrs, whereas IFPRI uses 3 days recall period. • The recall period of 24 hrs was chosen by FAO as it is less subject to recall error, less cumbersome for the respondent and also conforms to the recall time period
When to measure dietary diversity? • The optimal time of year to measure dietary diversity of households or individuals depends on the objective of the survey or monitoring activity. • There are several scenarios to assist potential users in planning surveys. • More details please refer: “Guidelines for Measuring Households and Individual Dietary Diversity” Source: FAO
Activities to undertake before beginning data collection • Translation and adaption steps (i) Basic translation (ii) First Review (iii) Key informant and community meeting to refine the food lists and translations • Technical issues to discuss prior to beginning data collection • (i) Minimum quantities • (ii) Individual food items that could be classified into more than one food group (decide appropriate food group) • (iii) mixed dishes: team will need to agree on a way to disaggregate mixed dishes in order to record all of the individual components in their respective food groups. • Training Survey interviewers Source: FAO
How to Create Dietary Diversity Scores • As per FAO, Dietary Diversity Scores are calculated by summing the number of food groups consumed in the household or by the individual respondent over the 24 hrs recall period. • Whereas, we are measuring on the basis of 3 days recall period due to non-availability of data on 24 hrs recall period. Source: FAO
Create new food group variables for those food groups that need to be aggregated. • For example: HDDS the food group “Starchy staples” is a combination of “Cereals” and “White roots and tubers”. A new variable termed “Starchy staples” should be created by combining the answers to “Cereals” and White roots and tubers”. • STATA Command: • gen star_staple = 0 • replace star_staple = 1 if cereal ==1 | white_root == 1 • As a check, run a “Frequencies” test on all newly created variables and make sure that all value are either 0 or 1. There should be no values > 1 for the newly created variable
USING AND INTERPRETING RESULTS • There are no established cut-off points in terms of number of food groups to indicate adequate or inadequate dietary diversity for the HDDS. • Because of this, it is recommended to use the mean score or distribution of scores for analytical purpose and to set the programme targets.
When interpreting the dietary diversity score, it is important to keep in mind that
The dietary diversity score does not indicate the quantity of food consumed Diet varies across seasons and some foods can be available in large quantities and at low cost for short periods There may be urban/rural differentials in dietary diversity. Variety is often much greater in urban and peri-urban centres where food markets are adequately supplied and easily accessible