Download
1 / 38
460 likes | 1.05k Vues
Climate Change Teleconnections AO, NAO, ENSO, PDO. WS 2005/2006 Lecture/Seminar. Overview I. 20. Oct. Overview – General Introduction 27. Oct. Past climate variability (millions of yrs.) 3. Nov. Little Ice Age and Medival Warm Period

E N D
Climate ChangeTeleconnections AO, NAO, ENSO, PDO WS 2005/2006 Lecture/Seminar
Overview I • 20. Oct. Overview – General Introduction • 27. Oct. Past climate variability (millions of yrs.) • 3. Nov. Little Ice Age and Medival Warm Period • 10. Nov. The last 100 years – the instrumental record • 17. Nov. Teleconnections: ENSO / NAO / PDO • 24. Nov. no seminar • 1. Dec. no seminar
Overview II • 8. Dec. Almuth / Katja, Clouds; Olav, CC in NL • 15. Dec. Mitja, CH4 Hydrates; Carolyn, Ocean CO2 Dynamics • 22. Dec. Michael, CC in Siberia Bettina, Treelines and CC Daniel, ACIA? • 5. Jan. Case study: Subtropics • 12. Jan. Case study: Tropics • 19. Jan. Recent catastropies and CC? • 26. Jan. Humans do not have an impact – The climate critics
Following graphics either from the IPCC webpage or free downloads (e.g. Wikipedia.org) or as cited.
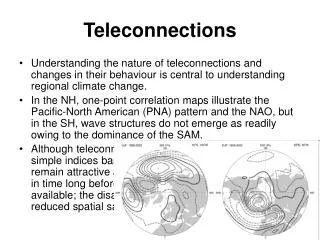
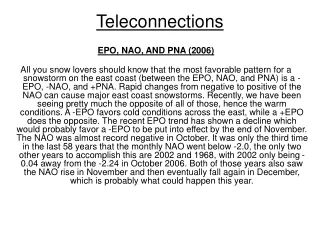
Teleconnection I Variability of atmospheric circulation Including weather patterns at time scales: days, e.g. frontal system; weeks, e.g. mid-summer wet period months, e.g. cold winters years, e.g. period of hot summers, droughts centuries, e.g. climate change
Teleconnection II Teleconnection patterns refer to recurring and persistent, large-scale pattern of pressure and circulation anomalies that spans vast geographical areas. Preferred modes of variability Teleconnection patterns are a naturally occurring aspect of our chaotic atmospheric system, and can arise primarily as a reflection of internal atmospheric dynamics.
Outline: NAO – North Atlantic Oscillation PDO – Pacific Decadel Oscillation ENSO – El Nino / Southern Oscillation Effects of or on climate change?
AO: Negative phase: H over polar regions, L at mid. lat. (45°N) Cold winter air to central US and Europe Positive phase: Lower over Arctic, higher pressure at mid. lat. Storm tracks further N wetter in Alaska, Scotland, Scandinavia; drier in Mediterranean and W US; colder in Greenland and Newfoundland
positive phase negative phase Arctic Oscillation Figures courtesy of J. Wallace, University of Washington
- + Arctic Oscillation Figures courtesy of J. Wallace, University of Washington
NAO: "In Greenland, all winters are severe, yet they are not alike. The Danes have noticed that when the winter in Denmark was severe, as we perceive it, the winter in Greenland in its manner was mild, and conversely." Hans Egede Saabyes diary (1770-78)
NAO +: Positive phase: Low low over N-Atlantic and strong subtropical high. Pressure difference increase strong westerlies The eastern US experiences mild and wet winter conditions
NAO -: The negative NAO index phase shows a weak subtropical high and a weak Icelandic low The reduced pressure gradient results in fewer and weaker winter storms crossing on a more west-east pathway Moist air in Mediterranean, cold air to N-Europe. The US east coast snowy weather conditions.
NAO phase implications: The trend in the NAO accounts for several remarkable changes recently in the climate and weather over the middle and high latitudes of the Northern Hemisphere, as well as in marine and terrestrial ecosystems: Strengthened subpolar westerlies from the surface to the lower stratosphere (Thompson et al. 1999). Milder winters in Europe downstream across Asia juxtaposed against more severe winters over eastern Canada and the northwest Atlantic (Hurrell 1995a; Wallace et al. 1995; Hurrell 1996; Shabbar et al. 1997; Thompson and Wallace 1998).
NAO phase implications: Pronounced regional changes in precipitation patterns (Hurrell 1995a; Hurrell and van Loon 1997; Dai et al. 1997) resulting in the advance of some northern European glaciers (Hagen 1995; Sigurdsson and Jonsson 1995) and the retreat of Alpine glaciers (Frank 1997). Changes in sea-ice cover in both the Labrador and Greenland Seas as well as over the Arctic (Chapman and Walsh 1993; Maslanik et al.1996; Cavalieri et al. 1997; Parkinson et al. 1998; McPhee et al. 1998; Deser et al. 1999). Pronounced decreases in mean sea level pressure (SLP) over the Arctic (Walsh et al. 1996).
NAO phase implications: Changes in the physical properties of Arctic sea water (Sy et al. 1997; Morison et al. 1998; McPhee et al. 1998; Dickson 1999; Dickson et al. 1999a,b). Changes in the intensity of convection in the Labrador and the Greenland-Iceland Seas (Dickson et al. 1996; Houghton 1996) which in turn influence the strength and character of the Atlantic meridional overturning circulation. Stratospheric cooling over the polar cap (Randel and Wu 1999), and total column ozone losses poleward of 40oN (Randel and Wu 1999; Thompson et al. 1999).
NAO phase implications: Changes in storm activity and the shifts in the Atlantic storm track (Hurrell 1995b), changes in within season variability such as blocking (Nakamura 1996). Trend in North Atlantic surface wave heights (Kushnir et al. 1997). Changes in the production of zooplankton and the distribution of fish (e.g., Fromentin and Planque 1996). Changes in the length of the growing season over Europe (Post and Stenseth 1999), and changes in the population dynamical processes of several terrestrial species (Post et al. 1999; Stenseth et al. 1999).
SLP at North Pole Hodges, Glenn, 2000. National Geographic
SLP at North Pole Hodges, Glenn, 2000. National Geographic
NAO and CC: Hurrell (1996) has shown, for example, that the recent upward trend in the NAO accounts for much of the observed regional surface warming over Europe and Asia, as well as the cooling over the northwest Atlantic over the past several decades. source and additional info http://www.ldeo.columbia.edu/NAO/
ENSO: Tropical influence Every 3-8 years Pressure loss over E Pacific Pressure rise over W Pacific Trade winds decrease Possible flip flop of Walker Circulation
Teleconnections El Nino: Increased precipitation across the southern US and in Peru, San Francisco 1926, 1983 Drought in the West Pacific (sometimes associated with devastating brush fires in AU)
La nina: Cooling of surface water west of S-America Stronger Walker Ciculation Stronger trade winds – Thermocline rise
Teleconnections La Nina: Precip rise: W-Pazific, oceanic influenced areas (e.g. Mozambique), S-Asia (during SW-Monsoon), N/NE-Australia, S-Africa, N-SAmerica, central America, Hawaii. Precip decline: Equatorial Islands central Pazific, middle E-Africa, S-SAmerica Hurricane frequency increased
PDO: Influences jet stream location Multi year variability Effect on ecosystem productivity in Pacific Effects of or on climate change?
PDO - phases: positive phase negative phase Image courtesy of Stepen Hare and Nathan Mantua, University of Washington, units are degrees Celsius