Download
1 / 21
250 likes | 597 Vues
Operations Management Capacity Design. Long Range Planning. Add Facilities. Intermediate Range Planning. Sub-Contract Add Equipment Add Shifts. Add Personnel Build or Use Inventory. Schedule Jobs Schedule Personnel Allocate Machinery. Short Range Planning.

E N D
Long Range Planning Add Facilities Intermediate Range Planning Sub-Contract Add Equipment Add Shifts Add Personnel Build or Use Inventory Schedule Jobs Schedule Personnel Allocate Machinery Short Range Planning Modify Capacity Use Capacity Types of Planning Over a Time Horizon
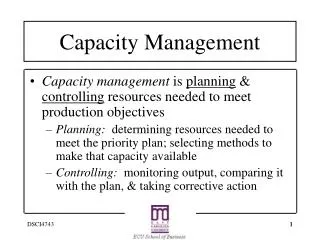
Definition and Measures of Capacity Design Capacity: The maximum “throughput,” or number of units a facility can produce in a period of time. Capacity a firm can expect to achieve given its product mix, methods of scheduling, maintenance, and standards of quality. Effective capacity: Utilization: Actual output as a percent of design capacity. Efficiency: Actual output as a percent of effective capacity.
Utilization Measure of planned or actual capacity usage of a facility, work center, or machine Actual Output = Utilization Design Capacity
Efficiency Measure of how well a facility or machine is performing when used Actual output = Efficiency Effective Capacity
Example Facility produces breakfast rolls • Last week, produced 148,000 rolls • Effective capacity is 175,000 rolls • Line operates 7 days a week with three 8-hour shifts per day • Line designed to produce 1200 rolls per hour • Determine • Design Capacity • Utilization • Efficiency
Calculating actual output Same facility adding one more line due to increase in demand for deluxe rolls • Effective capacity is 175,000 rolls of this line • Efficiency of this second line will be 75% • What is the expected output?
Managing Demand • Demand exceeds capacity – curtail demand by raising prices, scheduling long lead times, etc • Capacity exceeds demand – stimulate demand through price reductions, aggressive marketing, etc • Adjusting to seasonal demands– offer products with complementary demand patterns – pdts for which demand is high for one when low for the other
Managing Capacity • Making staffing changes (increasing or decreasing the number of employees) • Adjusting equipment and processes – which might include purchasing additional machinery or selling or leasing out existing equipment • Improving methods to increase throughput; and/or • Redesigning the product to facilitate more throughput
Breakeven Analysis • Technique for evaluating process & equipment alternatives • Objective: Find the point ($ or units) at which total cost equals total revenue • Assumptions • Revenue & costs are related linearly to volume • All information is known with certainty
Break-Even Analysis • Fixed costs: costs that continue even if no units are produced: depreciation, taxes, debt, mortgage payments, salaries, etc • Variable costs: costs that vary with the volume of units produced: labor wages, materials, portion of utilities
Breakeven Chart Total revenue line Profit Breakeven point Total cost = Total revenue Profit Total cost line Cost in Dollars Variable cost Loss Fixed cost Volume (units/period)
Process A: low volume, high variety Process B: Repetitive Process C: High volume, low variety Total cost - Process A Total cost - Process B Total cost - Process C Fixed cost - Process C Fixed cost - Process B Fixed cost - Process A Lowest cost process Process A Process B Process C Crossover Chart
Break Even Contd.. • BEPx= FC (units) P-V BEPrs.= FC (amount) 1-(V/P) BEPrs.= FC (multi product) ∑[(1-Vi/Pi)*(Wi)] P=Selling price, V=variable cost FC=fixed cost
BEP Calc. • A company has fixed costs of 10000/- this period. Direct costs are 1.5/- per unit and material cost is 0.75/- per unit. The selling price is 4/- per unit. Calculate the BEPs.
If the fixed costs are 3500, • BEPrs.= FC ∑[(1-Vi/Pi)*(Wi)] 3500*12 = 67200 0.625
Decision trees application • A company is considering capacity expansion. it has 3 alternatives. the new facility would produce new type of product and currently the marketability of the product is unknown. • Types of plant favorable mkt. unfavorable mkt. • Large plant 100 k -90k • Medium plant 60k -10k • Small plant 40k -5k • The probability of fav and unfav. Markets are 0.4 and 0.6 respectively.
EMV (large plant)=0.4(100k)+(.6)(-90k)=-14k • EMV (medium plant)=0.4(60k)+(.6)(-10k)=18k • EMV (small plant)=0.4(40k)+(.6)(-5k)=13k • Based on Expected market value, the company should build a medium plant
Net Present value • A co. having two capacity expansion alternatives A and B have useful lives of 4 years. Initial outlay for A is 25k and that for B is 26k. The cost of capital is 8%.the cash flow pattern is as follows. year A B 1 10k 9k 2 9k 9k 3 8k 9k 4 7k 9k