Download
1 / 34
350 likes | 530 Vues
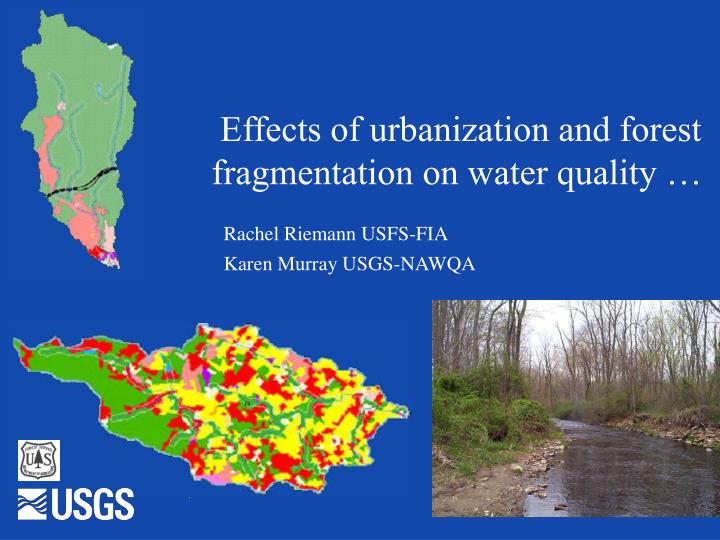
Effects of urbanization and forest fragmentation on water quality …. Rachel Riemann USFS-FIA Karen Murray USGS-NAWQA. Opportunity for collaboration.

E N D
Effects of urbanization and forest fragmentation on water quality … Rachel Riemann USFS-FIA Karen Murray USGS-NAWQA
Opportunity for collaboration In this study we take advantage of current USGS-NAWQA water quality monitoring efforts and link it to USFS-FIA’s current investigations into monitoring forest fragmentation and urbanization -- in order to better understand the relations between the two.
Problem We already know that urbanization has been linked to water quality in other studies But, what aspects of urbanization and/or forest fragmentation are most highly correlated with the biological, chemical, and physical responses observed in streams?
a combination of interests… • USGS-NAWQA • Improve understanding of the components impacting water quality in order to better provide management guidelines for preventing or minimizing degradation in the face of development pressure • Improve understanding of the forms and/or thresholds of that impact • USFS-FIA • Identify the components of frag/urban that are most related to observed changes in water quality, • Develop methods to monitor these relevant parameters of frag/urbanization with sufficient accuracy over large areas
Two rapidly urbanizing areas: • Appalachian ecoregion, especially the Pocono Mountains area • Fastest growing counties in Pennsylvania • Second home and primary home development • Transitioning from forested to suburban • Piedmont ecoregion • Including Philadelphia – Trenton corridor • Rapidly transitioning from agriculture to suburban Appalachian Plateau Valley and Ridge Piedmont Coastal Plain
Objectives • Identify which management-relevant landscape characteristics are most related to stream water quality and ecological health. • Describe the forms of these relationships. • Determine the influence of landscape data source (on interpretation/findings). • If necessary develop corrections or recommendations for use of those broad-area datasets currently available.
%urban (source: NLCD’92) NLCD’92 wasn’t sufficiently accurate to do the job, particularly in the less urbanized Poconos region Predictor data used
From Census Bureau data (2000) • Population • House density • Roads and road density (2000 TIGER data) Predictor data used • From photointerpretation of land use and land cover from digital aerial photography (1999-2000; some CIR, some B&W) • Land use polygons • land cover data recorded for each urban developed land use class (% tree, grass, house, road)
Site selection • Minimize point sources • Minimize natural variation – • - basin size all 20-60 mi2 • slope - all upland, riffle/pool sites • Accessible for sampling during both low and high flows • Selected representative sampling reach 150-300m long 33 sites
c o b b t a c o w y o m s h a b m i l l d a r f l n e s c r u m v a l l p i n e e b r c d i n g t o m s r i d l p i g e r a y m m a c o p i c k Station m a r s t o b y w b b r l h g o e b b r f r e n Piedmont sites p i d c s a w k Poconos sites h a y c v a n d b r o d l b u s f l a t 0 5 1 0 1 5 2 0 Road density (road miles/ sq. mi. basin) Bar graph-fixed
Illus maps East Branch Brandywine East Branch Red Clay Similar %forest and same amount of urban development, but different % forest in buffer, and different %C/I
Illus maps Dingmans Hay Similar %forest and amount of development, but a different distribution of land uses (COR, AI, and forest patch size covariance)
Macroinvertebrates • Algae • Habitat & geomorphology • Nutrients, ions • Pesticides in water • Discharge (instantaneous) • Temperature Field data collected
Loss of sensitive macroinvertebrates • Increase in chloride, sulfate, other major ions • Decrease in habitat quality • Increase in nutrient concentrations Primary responses related to urbanization (rdden) What are the primary biological, physical, and chemical responses that are related to urbanization?
2 What are the primary biological, physical, and chemical responses that are related to urbanization? • Increase in Pesticide Toxicity Index • Increased variety and amounts of pesticides detected (especially insecticides) • Increased potential toxicity of streamwater to fish and invertebrates
Results--What are the changes we see? Ecosystem responses… • Loss of sensitive macroinvertebrates • Increase in chloride, sulfate, other major ions • Increase in nutrient concentrations • Increase in Pesticide Toxicity Index • Decrease in habitat quality
To what specific landscape characteristics (or combination of characteristics) are these responses related? • basin-wide land use • buffer zone land use • fragmentation indices for basin
Buffer-zone variables Buffer-zone variables * Buffer zone = 100m on either side of the stream
Landscape indices Distribution/frag measures
Can we combine some of these landscape factors to develop models of stream ecosystem response?
Multiple linear regression – Invertebrate community structure* MLR - invertebrates *ordination site scores
MLR-total nitrogen (spring) Multiple linear regression – Total nitrogen (spring sample)
What is the form of the response What is the form of the response? And how does data source affect observed patterns? • NLCD’92 • Currently available over entire US • NLCD2000 • Currently only exists in pilot areas. Expected to have US-wide coverage in the next 5 years or so…
“Correcting” the NLCD92 dataset example in to the Poconos area… NLCD’92 …with roads overlaid on top NLCD’92 – ‘corrected’ using local road density
Differences-plots Basin stats Buffer stats
Where it helps and where it doesn’t… • Helps: • %urban land in basin
Where it helps and where it doesn’t… • Not much help: • %urban land in buffer
Differences between them • Description, comparison maps and comparison plots Photointerpreted land use (1999) NLCD2000 (note land cover focus) NLCD’92 (note missing development)
Looking at NLCD2000… Being a land cover product, NLCD2000 urban developed land uses are more related to impervious surface than the entire developed area. And, areas that are sparsely developed, have small house footprints, and/or have trees overshadowing roads or buildings may still contain only a few ‘developed’ pixels in the NLCD2000 dataset within a background of grass (or forest)
Concluding thoughts… • Landscape variables most related to stream ecosystem response • %Forest in the basin (and its close opposite--%developed) • The type of developed land in the basin (e.g. C/I) • Distribution of land uses within the basin can be a factor • Amount of forest or urban in the buffer • COR, AI-Forest, diversity of forest patch sizes • Land cover • % impervious • And, although the data wasn’t fully analyzed, there was some evidence suggesting that the land cover of developed land uses may be a factor as well (e.g. forest vs. grass covered residential).
Concluding thoughts • Data source • You sometimes need the detailed land use/land cover information to find out what’s really going on • And you need an understanding of its relationship to the broadly available datasets for extrapolation over large areas • Be very careful using threshold values derived using one land use data source and applying them to another
Concluding thoughts • The cooperative effort provided a unique opportunity • To link forest and water studies to expand ecosystem knowledge • To investigate the linkage between a process-level study establishing relationships between factors and broad scale methods for scaling the results up to an entire region.