Download

1 / 21
210 likes | 333 Vues
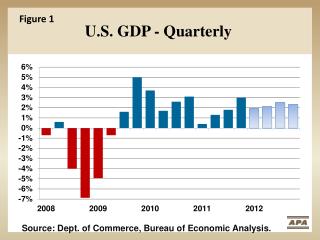
U.S. GDP and Trade Nominal $$ billions. www.bea.gov. Top U.S. Trade Partners Total Trade: Exports Plus Imports Rank by Exports( US $--billions). http://www.census.gov/foreign-trade/balance. Trade with Canada, 2010 in billions of dollars. tse.export.gov.

E N D
U.S. GDP and Trade Nominal $$ billions www.bea.gov
Top U.S. Trade Partners Total Trade: Exports Plus Imports Rank by Exports( US $--billions) http://www.census.gov/foreign-trade/balance
Trade with Canada, 2010in billions of dollars tse.export.gov
Trade with Mexico, 2010in billions of dollars tse.export.gov
Trade with China, 2010in billions of dollars tse.export.gov
U.S. Balance of Payments 2008 ($ billions) Current Account -706.0 Merchandise trade balance -695.9 Goods & Services exports 1,826.6 Goods & Services imports -2,522.5 Net Transfers -128.3 Net Income Payments 118.2 Capital Account +706.0 Increase in U.S. holdings of foreign assets -106 Increase in Foreign holdings of U.S. assets 505,166 Statistical Discrepancy +200 http:bea.gov
U. S. Goods Trade Balance With Other Nations, 2010 ($US - billions) http://www.census.gov/foreign-trade/balance/
U.S. Balance of Payments 2010 ($ millions) Current Account -470,898 Goods & Services exports 1,837,577 Goods 1,288,697; Services 548,878 Goods & Services imports -2,337,604 Goods -1,934,555; Services -403,048 Net Transfers -136,095 Net Income Payments 165,224 Capital Account +470,898 U.S. Owned Assets Abroad -1,005,182 Foreign Owned Assets in the U.S. 1,245,736 Capital Transactions -15 Statistical Discrepancy +216,761 http:bea.gov
Statistical Comparison of NAFTA Countries, 1997(In current U.S. $$) Statistical Comparison of NAFTA Countries, 2010 (In current U.S. $$) http://web.worldbank.org
Hourly Compensation Costs for Workers in Manufacturing, Selected Countries, 2010 (current dollars) Labor Costs (in $ U.S.) United States34.74 Canada 35.67 France 37.68 Germany 43.76 Italy 33.41 Japan 31.49 United Kingdom 29.44 Korea 16.62 Mexico 6.23 Singapore19.10 Philippines 1.90 v www.bls.gov