Download
1 / 54
550 likes | 560 Vues
EDSIMR – a regional FEW model. Chen, C.C., D. Gillig, and B.A. McCarl, "Effects of Climatic Change on a Water Dependent Regional Economy: A Study of the Texas Edwards Aquifer," Climatic Change , 49, 397-409, 2001. Geographic & Hydrologic Scope. Geographic & Hydrologic Scope.

E N D
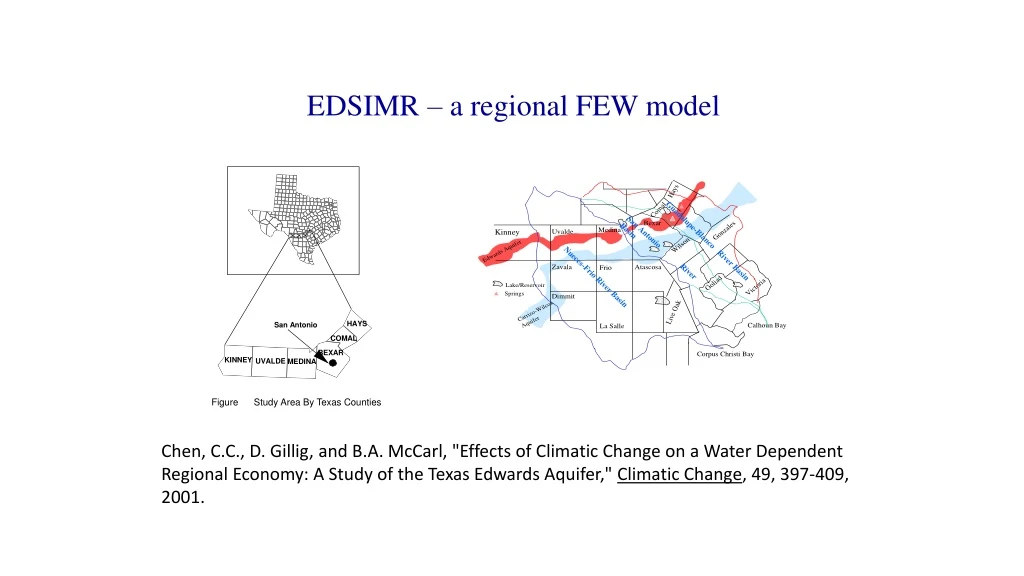
EDSIMR – a regional FEW model Chen, C.C., D. Gillig, and B.A. McCarl, "Effects of Climatic Change on a Water Dependent Regional Economy: A Study of the Texas Edwards Aquifer," Climatic Change, 49, 397-409, 2001.
Geographic & Hydrologic Scope • 4 River Basins + 5 Aquifers + 2 Springs + 6 Lakes/Reservoirs • EA discharges through springs and wells • Comal and San Marcos Springs => habitat for endangered species • Well discharge => Agriculture, Municipality, Industries, power, fracking Hays Non-Agriculture Comal - Medina Bexar Kinney Uvalde Edwards Aquifer Wilcox - Carrizo Aquifer Calhoun Bay Corpus Christi Bay Agriculture Lake/Reservoir Springs
Edwards Aquifer – significance • Main Source of Water Supply to the City of San Antonio • City of San Antonio is the sixth largest city in the U.S. • Population => over 1.5 million in city 2.4 million metro • ranks third among large U.S. cities in population growth • 4.3 million population will be in SA metro by 2050 • Corpus Christi Metro has 452k population and will be 550k in 2050 • Victoria Metro has 100k population and will be 115k in 2050
Edwards Aquifer – background • Use Competition farmers municipality industries recreationalists environmentalists Source: http://www.tpwd.state.tx.us/park/lakecorp/lakecorp.htm Source: http://www.edwardsaquifer.net/species.html
Edwards Aquifer – background • Increase Environmental Awareness Endangered species Texas Blind Salamander Fountain Darter San Marcos Gambusia San Marcos Salamander Source: http://www.edwardsaquifer.net/species.html
Edwards Aquifer – background Terrible drought in the 1950s, caused water planning but little progress Edwards Underground Water District created in 1959 and it was charged with conserving and protecting water in the Aquifer. However, it had no authority to restrict groundwater pumping Painfully pointed out by fish farm in 1991 using one fourth as much water as San Antonio. In May 1991, the Sierra Club filed a lawsuit against the U.S. Fish and Wildlife service claiming the Service was not adequately protecting endangered species that depend on the Aquifer. In January 1993 Federal Judge ruled in favor of the Sierra Club and ordered that springflow must be maintained even during a drought like in the 1950s. In May 1993 Senate Bill 1477 replaced the Edwards Underground Water District with the Edwards Aquifer Authority authorized to issue permits and regulate groundwater withdrawals In February 2002 the Texas Supreme Court reaffirmed Authority's powers to regulate pumping. More Info:http://www.edwardsaquifer.net/pdf/the-little-fish-ssrn.pdf http://www.edwardsaquifer.net
Edwards Aquifer – background The Edwards Aquifer is an underground layer of porous, honeycombed, water-bearing rock that is between 300-700 feet thick. A lot like an under-ground river Capacity 200 Mil af Recharge 674K af Pumping 450K af http://www.edwardsaquifer.net/intro.html
Edwards Aquifer – background • Water Scarcity increasing water demand decreasing water supply (regulation:SB 1477 => 450K to 400K af, or drought) Source http://www.edwardsaquifer.net/charts.html
Edwards Aquifer – background Two Correlated Pools West East Data source: Edwards Aquifer Authority http://www.edwardsaquifer.org/scientific-research-and-data/aquifer-data-and-maps/historical-data/historic-data-downloads
Edwards Aquifer – background Is recharge dropping?
Edwards Aquifer – background Edwards is vulnerable note much less recharge under La Nina
EDSIMR – the concept • Unify • Detailed aquifer hydrologic model • Regionalized economic Model • Surface water flow model • Hydrology embedded in regional economic model via regression (Keith Keplinger dissertation) • Keith O. Keplinger. "An investigation of Dry Year Options for the Edwards Aquifer. " Ph.D. Thesis, TAMU, 1996. • File Number 598 - Keplinger, K.O., and B.A. McCarl, "Regression Based Investigation of Pumping Limits and Springflow Within the Edwards Aquifer", Texas A and M University, 1995. • File Number 829 - Gillig, D., B.A. McCarl, and F.O. Boadu, "An Economic, Hydrologic, and Environmental Assessment of Water Management Alternative Plans for the South-Central Texas Region", Journal of Agricultural and Applied Economics, 33, 1 (April ), 59-78, 2001.
EDSIMR – Components ? Edwards Aquifer Groundwaterand River System Simulation Model ? AKA RIVERSIM What is contained in EDSIMR ? • Simulation Model (GAM) • springflow, beginning/ending aquifer elevations, pumping • Econometric Model • springflow/ending = f (beginning, recharge, pumping) • Mathematical Linear Programming • Components : objective function • : ag, M&I power and fracking decision variable • : constraints • : Surface water Network flow • : ground water characteristics • Linkage : Ground Water + Surface Water
EDSIMR – Example Analysis Objectives • Evaluate the economic and environmental consequences of a set of water management and energy project plans • Determine the “best” mix of water and energy retrofit options for a given demand and environmental constraints • Undertake a comparative assessment of the model “best” set of water management and energy project plans.
EDSIMR – the scope Water Rights, & Markets Reuse Water Project Use (Exist and New) Aquifers (Edwards, Carrizo-Wilcox, Gulf Coast, Trinity) Treatment Plants Investments State of Nature Modeled Water Demand New Water Projects (Y/N) Rivers (Nueces, Guadalupe, San Antonio) Aquifer Diverters River Diverters Hydrological Processes Energy Retrofits (Y/N) Reservoirs (Canyon , ChokeCanyon, ColetoCreek, Lake Corpus Christi, Medina Lake, Lake Texana) Aquifer recharge, Depletion, Elevation River Flows Return Flows Evaporation
EDSIMR – demand scope Modeled Water Demand Municipal Water Brackish Water Reuse Water Projects (Exist & New) Industrial Water Use Treatment Plants Electrical Cooling Water Treatment Plants Aquifer Diversion Agricultural Water Use Cropland Crop Production Return Flows River Diversion Fresh water Fracking Water Use Livestock Production Water Recreation Pasture& Range Red means we are Working on adding it Hydro-Electric Environmental
EDSIMR “System” (and friends/ancestors) Simulator Bundle Crop and Env Simulators (EPIC/SWAT) Livestock Data Non Ag Resource Demand Pest Regressions Regional Crop Mix input use Env. loads SWAT Regionalizing Model EDSIMR Runoff Simulators (SWAT) GIS Water Quality Groundwater Simulator (GAM) GCMs
EDSIMR – Basics of Stochastics • Discrete Stochastic Model :9 weather states • 2 Stage Decision • Stage 1 • Water and energy projects • Crop mix • Livestock numbers • Initial levels of aquifers and reservoirs • Stage 2 • Crop water use strategy • Recharge and surface inflows • Pumping/diversion • Water flows
EDSIMR – stochastics Aquifer storage identity Different Rain and Recharge under Different SONs HDry MDry SONs specific Ag & M/I use Water trades Aquifer Storage Springflow Aquifer elevation Energy and water Projects & retrofits, Crop mix, herd size, Irrto dry, dry to pasture Dry DNormal Normal WNormal Wet MWet HWet
EDSIMR – Basics of Stochastics • Stochastics • Temp and precip • Crop Yields and Water Requirements and pest costs • Livestock stocking rate • Livestock performance • M&I demand • Cooling requirements • Water available
EDSIMR – River flow detail Upstream inflow + New Additional inflow + Return flow + Spring discharge + Lake release + Treated reuse + Project water Diversion + Aquifer recharge + Evaporation + Lake addition + Downstream/bay outflow = New additional inflow R1 Aquifer Evaporation Add to Lake Recharge R2 Inflow Spring Discharge Lake release c Pump ground Diversion User Return flow Reuse Outflow Project water R3
EDSIMR – Demand Summary Agriculture: • 23 crops and 5 animal types are covered • Fixed price are used for all commodities. Municipal water demand: • Demand function with constant elasticity present for each county and 4 major cities (San Antonio, Victoria, Corpus Christi, and Gonzales) in the region. Industry water demand • Demand function with constant elasticity are present in the model for each county. • Electricity KWH demand • Fixed price?? • Model can choose water demand depending on technology and retrofit plus new • Fracking activity– • Fixed amount • Model can choose water demand depending on technology and retrofit plus new • Water for Recreation, instream flows, escape to bay and estuary • Fixed price • For Now one homogeneous water later may allow substitution of alternative qualities for some uses or some part of uses
EDSIMR – Water Supply Summary • Surface Water • Divert water from river or stream directly • Limited by water permits capacity for all rivers in Texas • Aquifers • Pumping water from Major Aquifers • May limited by water permits and other regulation • Some aquifer contains brackish water (high treatment cost) • Water Projects (from region L and later others) • Get water from other regions by pipelines • Water reuse • Build new reservoirs • Desalinate brackish water or seawater • Aquifer Injection
EDSIMR – Incorporating Water Markets Water Market Water use and rights Agricultural Water use and rights Municipal Water use and rights Industrial Includes friction in mkt ($50 in Edwards)
EDSIMR – Incorporating Projects and Retrofits • Water management options (e.g. dams, reallocations, artificial recharge, etc.) • Power and fracking retrofits • New power • Capacities • Amortized fixed costs • Joint constraints between the water development alternatives • Interdependencies between management options • Mutual exclusivity between some options • Tradeoff between water supply benefits and investment fixed costs
EDSIMR – Possible Projects and Retrofits AgIrrigation methods and practices Alternative crops Land to dryland or grazing Removing minimum limits Degraded water use Crop mix Dry year option WaterUse of more distant aquifers Injection &recovery Reservoirs Saline sources Enhanced recharge Conservation Reuse Broader markets and leasing EnergyAlternative cooling Coal to Natural Gas Renewables wind solar Geotherm Import more Fracking water reuse Fracking technology
EDSIMR – Conceptual Results • Projects built • Water Use Pattern and Trading • Economic Effect by party • regional ag farm income + non-ag net surplus • regional water prices and costs • Hydrologic Effect • EA elevation at the J-17 well index and river flows • Environmental Effect • spring flows, river flows, and the Estuary bay flows • Social Effect
EDSIMR Now we go technical
EDSIMR – Objective function terms • Municipal Elasticity • Industrial Elasticity • Climate demand shifts • Max Expected Regional Net Benefit • agricultural sector => revenues – production cost • non-agricultural sector => areas under demand – supply curves • Power – operations cost and rev from fixed price • Fracking – operations cost and fixed demand • Env sector – to be determined • Project cost and retrofit cost (water, power, fracking)
EDSIMR Objective Expected Net Benefits Maximization Net Ag income from Irr and dry Crop and animalproduction areas under M&I demand curves The objective function is a probabilistically weighted across the states of nature to reflect stochastic weather Less SON independent costs Ag pumping delivery costs M&I Water Mkt Transaction costs Annual project dev costs - Integer Crop plant cost Animal acquisition annual cost Cost of irr to dry or dry to past
EDSIMR – Agriculture Sector Land Modeling • Land Balance: Cropland + Pasture <= Total available land • Land Transfer • Land use decisions are made in Stage 1 of the model (CROPACRES and LIVEPROD) Irrigate via Furrow Dryland Pasture Irrigate via Sprinkler
EDSIMR – Agriculture Sector Crop Mix Modeling • Crop Mix Balance • Crop mix should be a convex combination of historical crop land allocation • Dryland and Irrigated crops mixes are counted separately
EDSIMR – Agriculture Sector Crop Production Modeling • Crop Strategy Balance • Sum_strategy of StratAcres(stateofnature, strategy)<= CropAcres for all county, zones, crops, irrigstatus • Crop Production Balance Crop Production (stateofnature)<= sum_strategy [Yield_(stateofnature, strategy)*StratAcres_(stateofnature, strategy) ] for all county, zones, crops, irrigation method HDry Strategy1 Different yield and water use under different strategies and state of nature MDry Strategy2 Land Use Decision ... MWet Strategy3 HWet Strategy4
EDSIMR – Agriculture Sector Crop water and livestock Modeling • Crop Water Use Balance Crop water use (stateofnature)= sum_strategy [CropWaterUse_(stateofnature, strategy)*StratAcres_(stateofnature, strategy)] for all county, zones, crops, irrigation method and month • Livestock (Similar to Crops) • Herd size set in phase 1 • Constrained by livestock mix • Constrained by land use in AUMS • Feeding decisions are made in stage 2 • Possible sell off in stage 2???
EDSIMR – User Water use balance • For each sector and county, Water used <= • Water diverted from Rivers (if this county has diverters for the specific sector) • Water pumped from Aquifers (if this county seat on the aquifer) • water from water projects (if the county is project destination and the sector is the target sector) • reuse
EDSIMR –Water rights, and Markets • Diversion Constraint: Amount of water diverted from river by one permit +Sold to others not in current version -Buy from others not in current version <= Permitted Capacity
EDSIMR – Reservoirs Storage at the end of last month Release to river in this month • Reservoir Balance Reservoir storage in current month <= Reservoir storage in last month + Withdraw from River – Release to River • Reservoir Storage Balance • Reservoir initial storage level is the weighted average of December ending storage level under all states of nature. Reservoir Initial Storage (Storage level on Jan 1st ) <= sum_stateofnature (prob_stateofnature * DecStorage_stateofnature) • Reservoir Capacity Reservoir storage <= Reservoir Capacity Withdraw from river in this month Reservoir Storage at the end of this month
EDSIMR – Aquifers • Aquifer Initial Elevation Balance • Aquifer Initial Elevation is the weighted average of Aquifer December ending Elevation in different state of nature. • Aquifer Elevation • Aquifer Elevation is estimated by econometric model using the simulated result of GAM EndLift=f(BeginLift, Recharge, Pumping, Drainage, Endlift in related Region, etc) • Spring Discharge • Spring Discharge is estimated by the same method of Aquifer Elevation • SpringDischarge=f(BeginLift, Recharge, Pumping, Endliftin related Region, etc)
EDSIMR – Projects Water, Power, Fracking • Integer variables in most cases • Capacity Constraint • Water from projects <= the project capacity if the project is built. 0, otherwise • Project capacity may be stochastic • Operating cost per acre foot • Fixed amortzed construction costs per project • State of nature (stage 2) operation • Injection Balance • Water could only be recovered in the Hdry state • Water recovered in the Injection projects in Hdry state <= water injected into aquifer in other state of nature
P P2010 Q Q’ MC Q Q2010 (Q2010+∆Qc) Figure 5: Mun-city Water Demand Curve & its Climate Shift Factor EDSIMR – Constant Elasticity Demand Function • The Constant elasticity demand function where F is a constant and E is the elasticity • is the price and quantity point that the curve will pass through • Solve for the unknown value of F getting • We then could get - + a • Set , the integration becomes a function of X
EDSIMR – Separable programing • Suppose we write X as convex combination of and using some new variable , • We then get + • Do steps on • See McCarl and Spreen or 1212 on web
EDSIMR – Data Requirements • Water Demand by non ag users • Power and fracking data • Hydrological data • Aquifer recharge and discharge distribution • Weather -temperature, precipitation • Agricultural production budgets • Development alternatives • water development costs • agricultural and non-agricultural pumping/diversion costs • water supply seasonally by recharge SON • Power and fracking retrofits, fixed and operating costs
EDSIMR – Sample Analysis Results Adoption of the new management regime comes at the expense of regional water users, in particular, non-agricultural users. Agricultural users marginally gain not because of agricultural operations but rather because of additional income generated by water sales. Ag sells a lot of water due to lower use value. Continuing the traditional rule of capture regime until 2012 would result in zero Comal spring flow under many states of nature. When pumping limits are imposed, Comal spring flow does not cease. Clearly some form of pumping restrictions are needed to avoid having the endangered species habitat compromised in the face of anticipated water demand growth. Water market improves water allocation efficiency transferring from lower to higher valued users Agricultural sector is better off due to additional income from water market sales
EDSIMR – Sample Analysis Results There is a distinct tradeoff in the EA region between the economic well being of pumping users and regional environmental attributes. Leaving behind the rule of capture to take on the highest of the HCP motivated pumping limits reduces regional pumping user related welfare by $246 million per year. The most extreme limit examined (175,000 acft) under the emerging HCP raises the welfare loss to $633 million per year. The emergence of the EA water market improves regional welfare to pumping users but worsens environmental attributes unless the East-West pools could somehow be factored into its design. Water development from alternative sources will be stimulated greatly by HCP related EA use restrictions. The EA region will have to develop an expanded set of water development alternatives if the severe Habitat Conservation Plan based restrictions are imposed.
EDSIMR – Sample Analysis Results • The EA ag sector is worse off. • The economic gain accrues to the EA non-agricultural sector, but is basically offset by the water development costs.
EDSIMR – Files Model part: Part 1 merges all of the data - parameters and sets, Part 2 sets up the model, Part 3 is solve and Part 4 runs the scenarios (in this case for climate). Calculation of data Agriculture data (set elements, crops and livestock budget and mixes, crop water alternative strategies, and Available land Climate data, including precipitation, temperature, and climate sensitivity data (e.g crop yield change under different climate scenarios)