Download
1 / 28
320 likes | 487 Vues
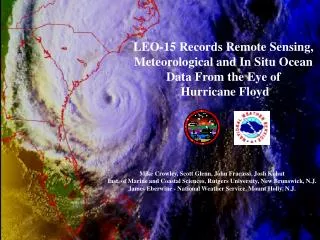
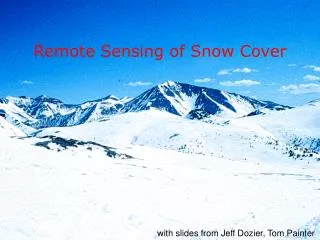
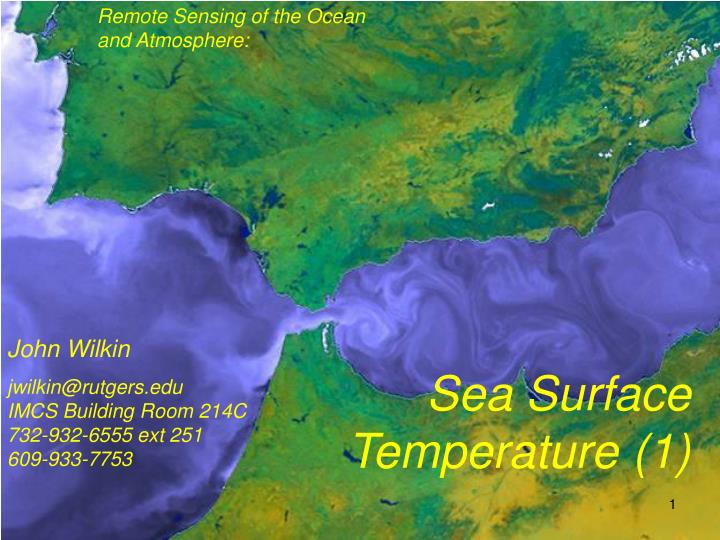
Remote Sensing of the Ocean and Atmosphere:. John Wilkin. Sea Surface Temperature (1). jwilkin@rutgers.edu IMCS Building Room 214C 732-932-6555 ext 251 609-933-7753. http://www.ssec.wisc.edu/data/sst. Polar Orbiting Environmental Satellites (POES) Office of Satellite Operations.

E N D
Remote Sensing of the Oceanand Atmosphere: John Wilkin Sea SurfaceTemperature (1) jwilkin@rutgers.eduIMCS Building Room 214C732-932-6555 ext 251609-933-7753
Polar Orbiting Environmental Satellites (POES) Office of Satellite Operations http://www.oso.noaa.gov/poesstatus
All the in situ temperature observations in Australia waters since 1950
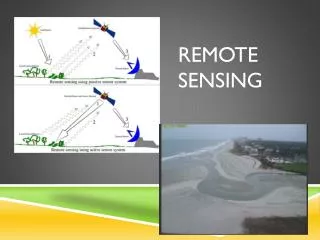
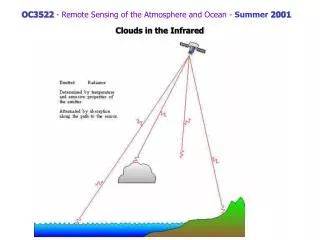
sensor Stratosphere volcanic aerosols Troposphere upwelled atmospheric radiance clouds tropospheric aerosols sun glint water vapor T Emitted surface radiance Ocean TS buoy Tb
p18 10-12 mm 3.5-4.1 mm Relative atmospheric transmission plotted vs. decreasing wavelength
Relative atmospheric transmission plotted vs. increasing wavelength 10-12 mm 3.5-4.1 mm
Sensitivity of brightness to change in blackbody temperature Brightness temperature difference due to atmosphere brightness of 300K blackbody 3.5 μm 10 μm 12 μm wavelength
At 11 μm, IR exitance comes from top 30 μm of ocean 2 μm 1 μm http://oceanworld.tamu.edu/resources/ocng_textbook/chapter06/chapter06_10.htm
Night time and strong winds (day or night) case Day time weak winds case See also Fig 7.4 in Martin
Small glaciers spill into a mostly dry valley in western Greenland in this picture from August 29, 2009. The Advanced Land Imager (ALI) on NASA’s Earth Observing-1 (EO-1) satellite acquired this natural-color image. The top view shows the wider area and the bottom view is a close-up of two glacier snouts. http://earthobservatory.nasa.gov/IOTD/view.php?id=40169
Tsunami damage, Gleebruk, Indonesia Before: April 12, 2004 After: Jan 5, 2005
Solar evaporation (salt) ponds near the foot of a long alluvial fan in the Pampa del Tamarugal, the great hyper-arid inner valley of Chile’s Atacama Desert. Alluvial fan sediments are dark brown. Astronaut photograph ISS019-E-14473, May 5, 2009 with a Nikon D2X digital camera fitted with a 400 mm lens, by the ISS Crew.
Millennium Island (Caroline Island prior to 2000) at the southern end of the Line Islands in the South Pacific, Republic of Kiribati. 32 atolls and 1 raised coral island. Millennium Island is formed from a number of smaller islets built on coral reefs. Max 6 m above sea level.
The Moon’s shadow engulfed Taiwan and a large swath of southeastern China and the Pacific Ocean on the morning of July 22, 2009, during an unusually long total eclipse of the Sun. This pair of images from the Japanese geostationary satellite MTSAT show the view of Earth at 8:30 a.m. local time in Taiwan (left) and an hour later (right), near the time in eastern China when the disk of the Moon completely overlapped the disk of the Sun (called totality). The longest period of totality occurred over the Pacific, where the total eclipse lasted more than 6 minutes.
Black Sea Aegean Sea Albania Greece Ionian Sea Italy