Download
1 / 44
440 likes | 520 Vues
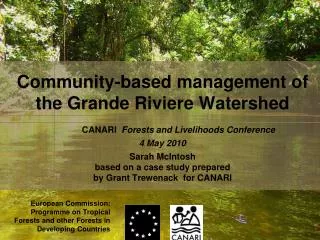
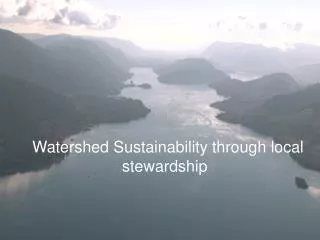
Bacteriological Monitoring Community-Based Watershed Stewardship in Kenya. This workshop is conducted by the Green Belt Movement and Global Water Watch, as part of a project funded by the U.S. EPA in Cooperative Agreement with the Institute for Governance and Sustainable Development. .

E N D
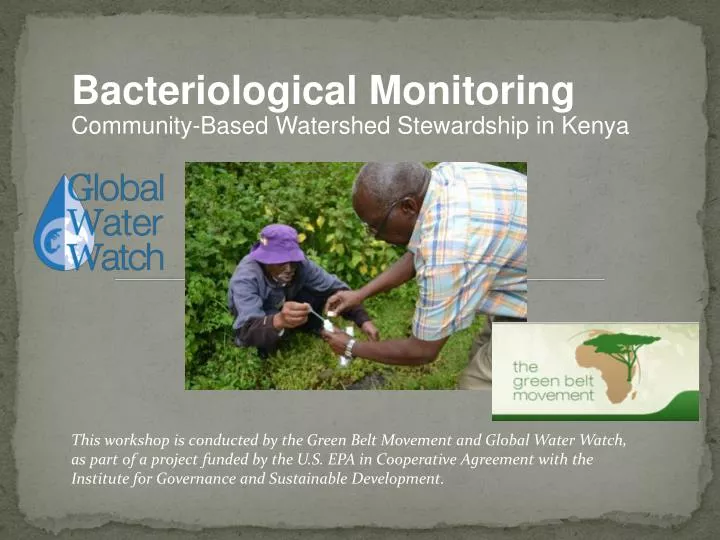
Bacteriological Monitoring Community-Based Watershed Stewardship in Kenya This workshop is conducted by the Green Belt Movement and Global Water Watch, as part of a project funded by the U.S. EPA in Cooperative Agreement with the Institute for Governance and Sustainable Development.
1. What is Global Water Watch (GWW) and how did they partner with the Green Belt Movement?
Water Facts • 1.2 billion people have no access to safe and • adequate water supplies • 3 billion people do not have adequate sanitation • 1 million deaths/year from waterborne infectious disease • … mostly children • 80% of all disease in developing countries is due to contaminated water and poor sanitation • Epidemic cholera reappeared in Latin America after a 90-year absence…now in 20 countries! • The poor pay the most for water, and suffer the most from water-related problems
2. What is the GWW-GBM Project in Community-Based Water Monitoring?
3. How can community members (non-specialists) collect good scientific information?
6. How does the flow and purity of rivers and springs relate to tree-planting and land cover?
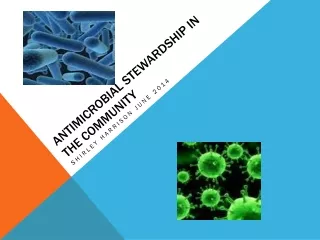
Campylobacter Shigella Listeria
13. How does E. coli get into water and what does this indicate?
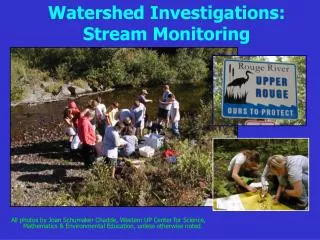
14. What are the characteristics of a good water monitoring site?
15. Why do we determine the GIS data (geo-reference) for each sampling site?
20. What is in the sample bottle and how does it indicate the presence of E. coli?
21. How does the plate work and why does the medium become solid when poured into the plate?
22. What is done with the water sample after it is put into the plate?
24. What happens to the E. coli when the sample is incubated? 29 - 37 24–48 hours
25. How is the number of E. coli determined from the incubated plates?
Determine Results Reading, counting and interpreting bacteriological plates
Counting Exercise • E. Coli = E/V x 100 • E. Coli = 7/1 x 100 • E. Coli = 7 x 100 • E. Coli = 700
26. What amount of E. coli in water is safe for human contact and drinking?
27. How can the E. coli data teach us about what is happening in a watershed?
Disturbing Trends! 40 42 38
Encouraging Trends! 40 42 38
28. How can we use this information to improve watersheds and drinking water quality?
29. How can we share this information with our family, friends, neighbors, educators, students, government officials, and the public?
30. What are the next steps for the GWW-GBM project and community involvement?
Global Water Watch and Green Belt Movement Project Community-Based Watershed Stewardship in Kenya Bacteriological Monitoring Workshop March 2014