Download
1 / 13
150 likes | 469 Vues
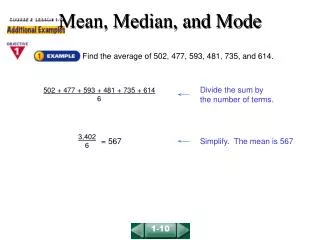
72 +87 +54 = 213, Then: 213 3 =71. Answer: The students average is 71. Your Turn Problem #1. Lori has 4 math tests with scores of 76, 85, 92, and 91. Find the average of all four tests. Objective A. Mean, Median and Mode. Mean (Average).

E N D
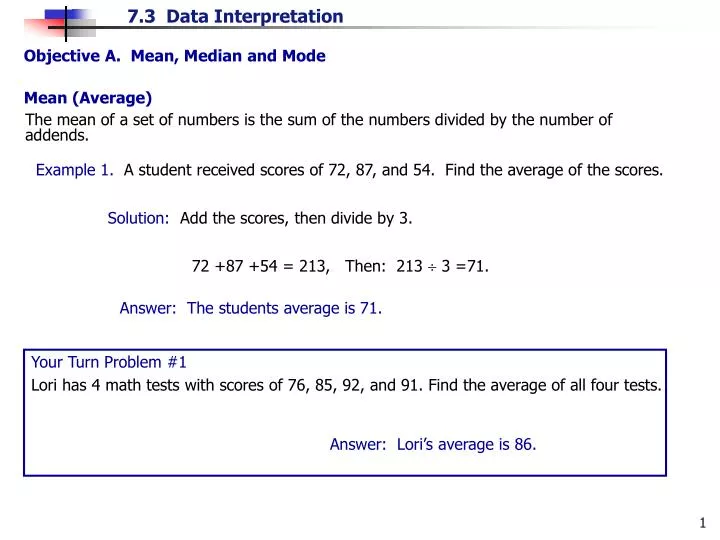
72 +87 +54 = 213, Then: 213 3 =71. Answer: The students average is 71. Your Turn Problem #1 Lori has 4 math tests with scores of 76, 85, 92, and 91. Find the average of all four tests. Objective A. Mean, Median and Mode Mean (Average) The mean of a set of numbers is the sum of the numbers divided by the number of addends. Example 1. A student received scores of 72, 87, and 54. Find the average of the scores. Solution: Add the scores, then divide by 3. Answer: Lori’s average is 86.
Multiplying grade point values by the number of units for each course Mathematics 4.0 4 = 16 History 3.0 4 = 12 English 2.0 3 = 6 Spanish 3.0 3 = 9 Biology 2.0 4 = 8 51 total Kelly’s grade point average was 2.8. Grade Point Average In most colleges, students are assigned grade point values for grades awarded. The grade point average, is the average of the grade point values for each unit taken. At most colleges, grade values are assigned as follows: A: 4.0 B: 3.0 C: 2.0 D: 1.0 F: 0.0 Example 2. Kelly earned the following grades for one semester. What was her grade point average? (Round to the tenths place.) Some classes carry more weight then others. Her A in math could count as 4-A’s. Rather than list them all out, we will multiply and then add before dividing. The total number of units taken is: 4 + 4 + 3 + 3 + 4 = 18 Now, divide 51 by 18.
Your Turn Problem #2 Sonya earned the following grades for one semester. What was her grade point average? (Round to the tenths place.) Answer: Sonya’s G.P.A. is 3.4.
The two middle numbers are 72,000 and 81,000 Your Turn Problem #3 The mass, in grams, of five eggs are as follows: 15 g, 19 g, 19 g, 14 g, and 18 g. Find median mass of the five eggs. Median Once a set of data is listed in order, from smallest to largest, the median is the middle number if there is an odd number of values. If there is an even number of values, the median is the number that is the average of the two middle numbers. Example 3. The salaries of six administrators at a large company are as follows: $72,000, $112,000, $68,000, $91,000, $71,000, $81,000 What is the median salary of the administrators? Solution: Arrange the numbers in order smallest to largest: 68,000 71,000 72,000 81,000 91,000 112,000 The median is the average of the two middle numbers. Answer: 18 g
Your Turn Problem #4 Find the mode or modes of these data: 1. 8, 12, 15, 27, 31, 42 2. 44, 55, 55, 55, 62, 65, 67, 67, 67, 72, 73, 75 Mode The mode of a set of data is the number or numbers that occur most often. If each number occurs the same number of times, there is no mode. Example 4. Find the mode of these data. 23, 24, 27, 27, 18, 29 Solution:The number that occurs most often is 27. A set of data has just one mean and just one median, but it can have more than one mode. It may also have no mode—when all the numbers are equally represented. Answer 1. There is no mode. 2. The modes are 55 and 67.
Answer: Both Shredded Shredded Wheat and Banana Nut Crunch have the greatest amount of fiber. Next Slide Objective B. To extract and interpret data from tables A table is often used to present data in rows and columns. The following table lists the nutrition information for five breakfast cereals. Example 5. a) Which cereal has the least amount of sugar? Answer: Shredded wheat has the least amount at 0.25 g b) Which cereal has the least amount of salt? Answer: Shredded wheat has the least amount at 0.25 g c) Which cereal has the greatest amount of fiber?
Your Turn Problem #5 a) Find the average distance from the Sun to Jupiter. b) How long is a day on Venus? c) Which planets have an average distance from the Sun that is greater that one billion miles? d) Which planets have a diameter that is less than 5000 mi? Planets: Use the following table, which list information about the planets. *Pluto is now called a dwarf planet. Answers a) 483,612,200 mi b) 224.59 earth days c) Uranus, Neptune, Pluto d) Mercury, Mars, Pluto
Objective C: To extract and interpret data from bar graphs Food on the Move Slice of Pizza Hut’s Pepperoni Pizza Burger King’s Whopper McDonald’s Big Mac Wendy’s Big Bacon Classic Subway’s Meatball Sandwich KFC’s Original Chicken Sandwich 0 5 10 15 20 25 30 35 40 Fat content (in grams, g) Source: Based on information from Olen.com and the Minnesota Attorney General's Office Example 6. a) Which item contains the most fat? Answer: Burger King’s Whopper Answer: KFC’s Original Chicken Sandwich b) Which item contains about 23 g of fat? Answer: 15 grams c) How much fat is in a subway meatball sandwich?
The following chart indicates the profit (in billions) for a “much too popular” coffee franchise. Your Turn Problem #6 a) How much did their annual profit increase by from 2002 to 2005? b) Which year had the largest decrease in profit from the previous year? Answers a) 60 billion b) 2006; $30 billion decrease c) 37.5% decrease c) What is the percent decrease in profit from 2006 to 2007? (Hint: Use P, B, A, where B = original and A = amount of increase or decrease)
Objective D: To extract and interpret data from line graphs Example 7. a) Between what two years was the increase in water level the greatest? Answer: 1970 and 1980 b) For which year was the water level the highest? Answer: 2000 Answer: 2005 c) For which year was the water level the lowest?
Average Salary of Major league Baseball Players. The following graph shows the average salary of Major League baseball players over a recent 12 year period. Salary (in millions) Year Your Turn Problem #7 a) In which year was the average salary the highest? Answers a) 2002 b) 1.6 billion c) 1996 b) What was the difference in salary between the highest and the lowest salaries? c) In what year was the average salary about $1.2 million?
Answer: 28 Next Slide Objective E: To extract and interpret data from circle graphs The following circle graph shows the favorite breakfast foods for students. Favorite Breakfasts Example 8. a. What is the most popular item? Answer: Cereal b. What percent of the students favorite breakfast food is eggs and pancakes? Answer: 31% c. If there are 400 students, how many of them chose waffles as their favorite food?
Disney World 3% Boston 4% Golden Gate Bridge 8% Yellowstone 12% Grand Canyon 15% Hawaii 58% The End B.R. 6-19-08 • Answer: • 42% • 1800 Vacation Destinations The circle graph shows where people would most like to visit are given in the list to the right. Your Turn Problem #9 a) What percent of the people did not choose Hawaii for the place they would most like to visit? b) Out of 12,000 people, how many of them would most like to visit the Grand Canyon?