Download

1 / 18
180 likes | 207 Vues
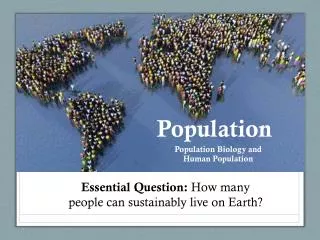
How do population pyramids help us learn about population?. Population pyramids are used to show information about the age and gender of people in a specific country. Male. Female. There is also a high Death Rate. In this country there is a high Birth Rate. Population in millions.

E N D
Population pyramids are used to show information about the age and gender of people in a specific country. Male Female There is also a high Death Rate. In this country there is a high Birth Rate Population in millions This population pyramid is typical of countries in poorer parts of the world (LEDCs.)
In some LEDCs the government is encouraging couples to have smaller families. This means the birth rate has fallen.
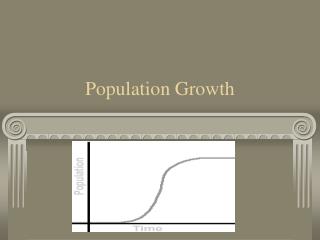
Male Female In this country the number of people in each age group is about the same. Population in millions The largest category of people were born about 40 years ago. In this country there is a low Birth Rate and a low Death Rate. This population pyramid is typical of countries in the richer parts of the world (MEDCs.)
Male Female Population in millions In the future the elderly people will make up the largest section of the population in this country. In this country the birth rate is decreasing. This is happening more and more in many of the world’s richer countries.
Male Female Population in thousands This country has a large number of temporary workers. These are people who migrate here especially to find a job.
Population pyramid for Mozambique. Population pyramid for Iceland.
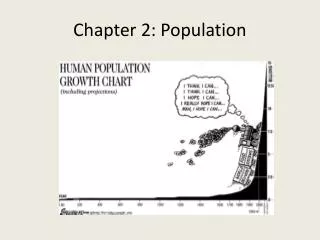
What is going to happen to Japan’s population in the future? Why does this matter?
Your task: • Create your own population report or PowerPoint presentation. • Go to www.census.gov www.census.gov • Select Search and type in IDB. • Select International Database • From here select Population Pyramids. • Find a population pyramid typical of a poor country (LEDC) copy and paste it into your PowerPoint document then add labels to explain what is shown. • Repeat for an MEDC (rich) country. • For a country of your choice copy and paste the pyramids for 2010, 2030 and 2050. • Write a paragraph about what each of the graphs shows and try to give reasons for the patterns. Explain how the population of this country is changing and say how that could affect the country. Include the infant mortality rate and life expectancy in your discussion. File path - Student pool/Geography/Year 9/Population/Pyramids
When you have finished; Find out some background information on each country and add this to your presentation. Concentrate on facts and figures which you can use to compare the countries such as % of the children at school, type of jobs available, how rich or poor (GDP per capita.)……… Due Wednesday10/26/16
To Review…what is due? • 5 pyramids with paragraph descriptions • 1 LEDC • 1MEDC • 3 of a country of your choice • Once paragraph or more of information about each of your three countries. Include information about infant mortality and life span.
How to create a population pyramid. • Google “census idb” • Click on the first link or go directly to: http://www.census.gov/population/international/data/idb/informationGateway.php • Under “Select Report” select “Population Pyramid Graph” • Select a year and a country • Click “Submit”