Download
1 / 42

E N D
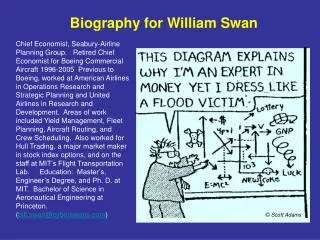
Biography for William Swan Currently the Chief Economist for Boeing Commercial Aircraft. Visiting Prof. at Cranfield. Previous to Boeing, worked at American Airlines in Operations Research and Strategic Planning and United Airlines in Research and Development. Areas of work included Yield Management, Fleet Planning, Aircraft Routing, and Crew Scheduling. Also worked for Hull Trading, a major market maker in stock index options, and on the staff at MIT’s Flight Transportation Lab. Apparently has a hard time holding a steady job. Education: Master’s, Engineer’s Degree, and Ph. D. at MIT. Bachelor of Science in Aeronautical Engineering at Princeton. Likes dogs and dark beer. • Scott Adams
Pricing and Revenue ManagementWhat and Why? Bill Swan Chief Economist Boeing Commercial Airplane Marketing Fall 2003
Outline HISTORY development over the last 20 years PRICING why several prices for tickets REVENUE MANAGEMENT making pricing work TYPE OF FARES 4 basic kinds BUSINESS FARES high value travel COACH FARE the posted fare DISCOUNT FARES tourists and vacations PROMOTIONAL FARES low fares to stimulate travel PRICE ELASTICITY traffic changes when fares change DILUTION the problem of everyone getting the lowest fare VOCABULARY "bucket," "authorization," and "nesting" USING THE RESERVATIONS SYSTEM an example FORECASTING DEMAND combining data and knowledge LOW COST CARRIERS a simpler pricing world OVERBOOKING adjusting for No Shows SUMMARY
Early Idea: Pricing • Some days flights were far from full • Protect seats sold at normal prices • Set aside some seats to sell cheaper • Find a way to keep normal trips from buying cheaper seats - Require early purchase (14 days ahead) - Require Saturday night stay • Original “Surplus Seat Sales” idea
Revenue Management is Born • Surplus seats can be sold at a discount • Discountpurchases tend to be earlier than full-fare purchases • Discount sales must be limited to protect full-fare space • Limit to estimated surplus seat count • This is a second limit, beyond the limit on total seats • Revenue Management setsdiscountlimits
Early Computerization • Computers used to forecast full-fare demand • Mathematical rules used to set buffers and surplus seat count • Difficult or nearly full flights separated out for people to monitor and manage • Pricing and Revenue Management became departments at airline.
Revenue Management Grows • Yet bigger discounts used to fill very empty flights • Carriers without a Revenue Management system put at a competitive disadvantage • Computer systems become increasingly complicated • Outside companies sell systems to airlines
The Why behind Different Prices • Larger airplanes cost less per seat than smaller ones • High-Value Demand Pays for High-Cost Seats • Lower-Value Demand pays for lower cost additional seats • Both Groups of Demand benefit from sharing fixed costs
Cost Per Seat High for First Seats, but Lower for Additional Seats
Total Revenues = Total Costsand both Fares Cheaper than Alone
Reasoning Behind Pricing • Full-fares pay much of cost of frequency • Discount fares pay some of the cost of frequency • Total fares cover total revenues • Both types of customers are better off than with one price.
Revenue Management Protects Seats • High fares make reservations close to departure day • Low fares could fill airplane and prevent high-fare sales • Revenue Management limits low-fare sales and protects high-fare space • Revenue Management does not set fares, pricing does • Most airlines match each other’s high fares • Lowest fares may vary by airline $1700 $600 $1900 $900
High and Low Fares: 4 Kinds of Fares • First or Business Class • The usual fare of high-value business travel • Typically 5% to 20% of passengers • Full-fare Coach • Smaller seat and smaller fare than business • Typically 0% to 20% of passengers • Discount Coach • The usual fare for tourist or personal travel • Typically 30%-50% of passengers • Promotional Discounts/tours/bulk/consolidator • Fares used to fill up seats on off-peak flights • Typically 30% to 50% of passengers $1900 $1700 $900 $600
Business Fares are for Premium Service Business Travel on long-haul demands high quality of service Comfort/food/airport/luggage/reliable departure This is the most valuable part of demand highest fare, least fare sensitive least dependent on economic cycles most frequent flyers Revenue Management protects Business Seats may save extra space in case a competitor “spills” traffic does not overbook business class seats - cannot have “oversales” of a premium customer $1900
Standard Discounts are for Pleasure Travel • These are fares regularly posted and sold by all travel agents. • The biggest danger is that these fares will be used for Business travel ("Dilution"). • Otherwise, these tickets are used for tourist and vacation travel. • Low end of regular discount fares may be below some promotion bulk fares, particularly after commissions are considered. $900
Promotional Discounts fill Empty Seats Promotion types: 1. "sales" lasting a week to generate bookings to fill off-peak flights 2. tickets sold by special discount agents when space is available 3. space sold in blocks to agents who resell at their own prices 4. low fare connections with other airlines (low "pro rates") 5. any other idea for selling without dilution of regular discounts $600
Higher Fares increase Business Revenue Airlines try to cooperate in keeping fares high If one airline lowers fare, others will follow Different from Discount demand
Lowering Discount fares Increases Revenues Lower fares gain Revenue when aircraft are empty Lower fare traffic must not be allowed to fill high-fare seats Revenue Management offers only surplus seats at low fares
"Dilution" means Business buying Discounts Dilution happens when a customer who should be paying a high fare type manages to get a lower fare type. For instance when a Business traveler uses a Discount ticket. Fare restrictions are designed to prevent "dilution": 1. Advance purchase requirements of 14-30 days 2. Stay requirements such as over Saturday night, or 7-14 days 3. Limitations on changing reservation or refunding ticket 4. Agent through which ticket was purchased, such as tour operator REVENUE MANAGEMENT IS NOT DESIGNED TO PREVENT DILUTION
Revenue Management uses Special Vocabulary • Fare "Bucket" = a fare letter code representing a single type of fare: "Business C," "Full-Fare Coach Y," or "Discount H." • "Authorization" = the number of seats allowed to be sold for one fare bucket. 3. "Nesting" = the idea that the Authorization for a high-fare bucket contains and has access to space of all lower fare buckets.
Nesting is the Way Space is Shared Example of standard revenue management “Nesting:” Authorizations of 174Y 170h 90K “nested” mean: K sales come out of larger H bucket H sales come out of larger Y bucket Y sales can use H or K space if Y-protected is full Nesting allows higher fares access to lower fare space “Protection” for each fare is space between next smaller nested bucket Example: 80 seats are “protected” for H, against K sales
Example of Yield Management on a Flight A flight AAA-BBB on Monday 3 October at 9:00 has 218 seats: 64 First/Business and 154 Coach Fares offered are: C = First/Business = $1900 Y = Full Fare Coach = $1800 H = Discount = $900 K = Promotion = $600 C fare gets Business Class seat (6 abreast, 96 cm pitch). Y fareis seldom sold in this market. It serves as an overflow for C. H fare is the standard tourist discount fare. K fare is sold by consolidators and special discount ticket agents.
Managing a Flight: Thinking it Through Revenue Management has estimated the demands: C = 34 with an possible high value of 44 Y = 0 with a possible high value of 4 H = 65 with a possible high value of 95 K = no estimate is made because no estimate is needed At the start, the seat counts are 64 for Business, and 154 for Coach. 1. Decide to protect 44 seats for C Show C44 as authorization. Sell remaining 20 seats as coach Total Coach authorization becomes 154 + 20 = 174 Shows Y174 as Y authorization. The person setting the level of 44 added 10 seats to the estimate of C demand. With C fares over twice the normal coach fare, he wanted to be sure to have space for extra C demand.
Example: Numerical Answers The airline's computer shows seat limits as: C44 = sell up to 44 in C class Business seats are put in separate category from Coach Y174 = sell up to 174 reservations in Y+H+K together. This could mean allowing up to 20 use Business seats H170 = sell up to 170 reservations in H+K together This "protects" 4 seats for possible Y reservations K90 = sell up to 90 reservations in K alone This "protects" 80 seats for possible H reservations
Forecasting Demand is Important Discount sales happen 2 to 10 months in advance. A forecast of higher fare demand is needed at that time. Before several years of historical data have been recorded, the insight of an experienced person (*) should be better than a computer forecast. Forecast depends on: 1. Recent history for the same flight *2. Adjustments for seasonal changes and growth rates *3. Knowledge of special events *4. Recent history of same flight, other days of week *5. Recent history of similar flights 6. Early booking performance of the flight in question *7. Knowledge of traffic on competing airlines’ flights.
Protection Levels display as Authorizations The values (C44, Y174, H170, K90) are limits on seats sold for flight. Setting the values is the job of Revenue Management. Values are passed to outside computers as: C04Y04H07K07 • Information passed to outside does not reveal more than 4-7 seats • This display allows agents to sell up to 4 C or Y seats, up to 7 H or K • A zero (such as K00) prohibits sales of K tickets
New Low Cost Carriers’ Systems can be much Simpler • Only one Sales outlet • Usually the internet • Reduced ability to sell deep discounts in different places to different customers • Closeness to departure date is best surrogate for value of trip • Markets tend to be price-elastic • Pricing has three principles: • Start with best guess of right price to just fill airplane • Adjust price up if sales are too brisk, down if too slow • Raise price in last two weeks for inelastic, high-value demand
Revenue Management System needs Watching If the Yield Management system works well: 1. Protected space will usually have SOME unused seats. 2. Protected space will sometimes have NO unused seats. 3. If all K seats are sold, on average only 15 seats will be empty. 4. Almost all high fare demand will be accommodated. 5. Most traffic turned away is low-fare (K) fare traffic.
No Shows mean Flights Should Overbook Not all people who reserve a seat on a flight show up at the gate. A reservation without a customer at the gate is a "No Show." Some Reasons for No Shows: 1. passengers change plans at the last minute 2. passengers also have bookings on another flight or airline 3. passengers cancel their reservations incorrectly 4. connecting passengers absent when inbound flight is delayed 5. false bookings by agents with no ticket written 6. record keeping errors "No-Show" rates can vary between 5% and 25%.
Overbooking Balances Sales and Oversales "Overbooking" means taking more reservations than you seats on the airplane. Counting on "No Shows" to match load to seats. Or counting on later cancellations to reduce bookings back down. For example: An aircraft with 218 seats An average "No Show" rate of 15% Overbooking to 245 reservations (12% extra) 100%-15% = 85% of bookings show up, on average 85% of 245 = 208 passengers, the "average" at the gate 1 time in 10 may have over 218 passengers
A Revenue Management System is Responsible for Overbooking Overbooking is part of revenue management Manager estimates no-show rate from past experience. Best amount of overbooking achieves correct numbers of unused seats. Measure "seats light" on flights booked "full" "Seats Light" means empty seats at departure time Measure on any flight booked full in discount Too many "seats light" means raise overbooking Too few "seats light" means lower overbooking Gate agents will always want less overbooking. Best revenues come from high overbooking.
Summary of Revenue Management • Pricing and Sales control Dilution, not Revenue Management. 2. Overbook to compensate for No Shows 3. Forecast high fare demands by fare type 4. Estimate errors for forecasts 5. Protect space for forecast demands and part of error 6. Keep track of "Seats Light" and Closed high-fare cabin statistics 7. Adjust forecasts and rules if items in (6) are not right 8. Remind Senior Management that revenue management does not raise yields. Revenue Management allows Pricing to increase revenues.
William Swan: Data Troll Story Teller Economist