Download
1 / 8
90 likes | 227 Vues
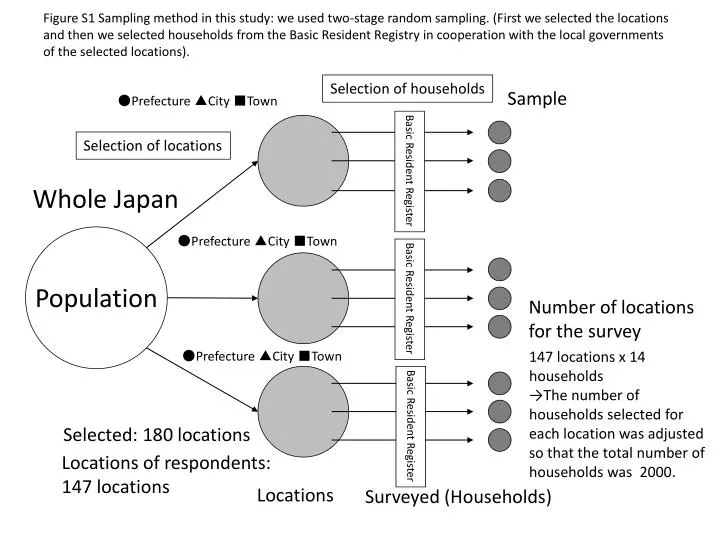
Figure S1 Sampling method in this study: we used two-stage random sampling. (First we selected the locations and then we selected households from the Basic Resident Registry in cooperation with the local governments of the selected locations). Selection of households. Sample.

E N D
Figure S1 Sampling method in this study: we used two-stage random sampling. (First we selected the locations and then we selected households from the Basic Resident Registry in cooperation with the local governments of the selected locations). Selection of households Sample ●Prefecture ▲City ■Town Basic Resident Register Selection of locations Whole Japan Population ●Prefecture ▲City ■Town Basic Resident Register Number of locations for the survey 147 locations x 14 households →The number of households selected for each location was adjusted so that the total number of households was 2000. ●Prefecture ▲City ■Town Basic Resident Register Selected: 180 locations Locations of respondents: 147 locations Locations Surveyed (Households)
FigureS2 Relationship between the number of sampled points and population in each prefecture; the locations selected for this survey reflect the population distribution in Japan as there is a good correlation between the results. Tokyo Number of selected locations Osaka Aichi Saitama Hyogo Fukuoka Kanagawa Hokkaido Chiba Population
表1 表1 Table S2Comparison of calculation results for weighting factors: (a) Conditional logit model, (b) Random parameter logit model (the figures in brackets in the table are the estimated values of the standard deviation)
Table S3Correlation matrix for weighting factors **: Significant at the 1% level, *: Significant at the 5% level The non-correlation test is performed to verify the hypothesis that there is no correlation between the two variables. If the result is determined to be significant, the hypothesis will be rejected and, statistically, this means that “there is a correlation between the two variables”.
Figure S3Frequency distribution of weighting factors for social assets WF1 (JPY/JPY10,000) and statistical values Comparison chart Probability Frequency Data value Normal distribution Fit
Figure S4Frequency distribution of weighting factors for primary production WF1 (JPY/kgDW) and statistical values Comparison chart Probability Frequency Data value Normal distribution Fit
Figure S5Frequency distribution of weighting factors for biodiversity WF1 (JPY/EINES) and statistical values Comparison chart Probability Frequency Data value Normal distribution Fit