Download
1 / 10

E N D
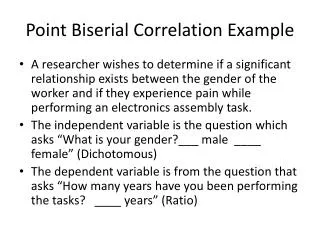
Pearson Correlation Example • A researcher wants to determine if there is a relationship between the annual number of lost workdays for each plant and the annual number of newly hired workers for each plant. The number of lost work days is ratio (dependent variable) and the annual number of new hires is also ratio (independent).
Step 1: Data Setup • The independent variable is the “x” variable and the dependent is the “y”.
Data Setup • For plant #1, they experienced 27 new hires and 30 lost work days, plant #2, 22 new hires and 26 lost work days, and so on. • Because you are looking for a relationship between 2 ratio variables, you’ll need to use Pearson’s Correlation.
Data Analysis • The next step is to set up the data table so you can run the procedure. You will need to set up an X2, Y2 and XY column. The X2 column is the X variable squared, Y2 is Y squared, and XY is X multiplied by Y.
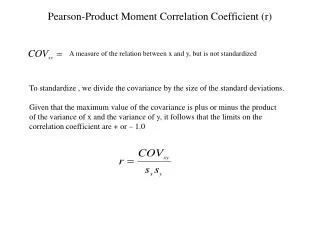
Pearson Correlation Formula The value .44 is interpreted as a weak correlation. The next step is to determine if it is significant.
Is the Correlation Significant? • Now we need to determine if the correlation coefficient is significant. • This is done by performing a t-test.
T-test for Correlations To interpret the 1.42, compare the t-test value 4.40 to the critical score. If the obtained score is greater than the critical score, reject the Null and accept the alternative. The critical score from the t-table at .05 and DF = 8 is 2.31. (NOTE: On a T-table, use the .025 column since .025 at one end and .025 at the other end gives you .05).
T-Table The critical score from the t-table at .05 and DF = 8 is 2.31. (NOTE: On a T-table, use the .025 column since .025 at one end and .025 at the other end gives you .05).
Conclusions • Since 1.42 is less than 2.31; Do not reject the Null Hypothesis and conclude there is not a significant relationship between the number of new hires and the number of lost workdays. • There is not a significant relationship between the number of new hires and the number of lost workdays.