Download
1 / 32
330 likes | 527 Vues
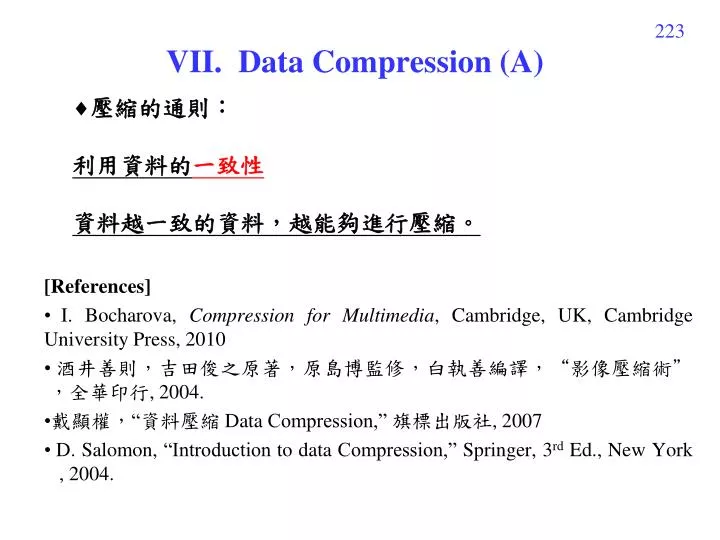
VII. Data Compression (A). 壓縮的通則: 利用資料的 一致性 資料越一致的資料,越能夠進行壓縮。. [References] I. Bocharova, Compression for Multimedia , Cambridge, UK, Cambridge University Press, 2010 酒井善則,吉田俊之原著,原島博監修,白執善編譯,“影像壓縮術” ,全華印行 , 2004. 戴顯權, “ 資料壓縮 Data Compression,” 旗標出版社 , 2007

E N D
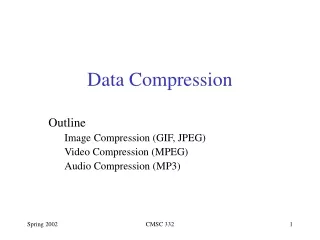
VII.Data Compression (A) • 壓縮的通則: 利用資料的一致性 • 資料越一致的資料,越能夠進行壓縮。 [References] I. Bocharova, Compression for Multimedia, Cambridge, UK, Cambridge University Press, 2010 酒井善則,吉田俊之原著,原島博監修,白執善編譯,“影像壓縮術”,全華印行, 2004. 戴顯權,“資料壓縮 Data Compression,” 旗標出版社, 2007 D. Salomon, “Introduction to data Compression,” Springer, 3rd Ed., New York , 2004.
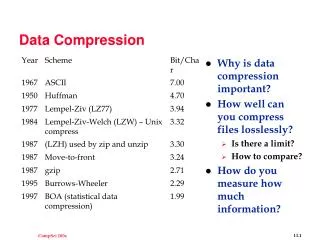
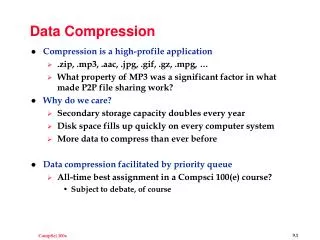
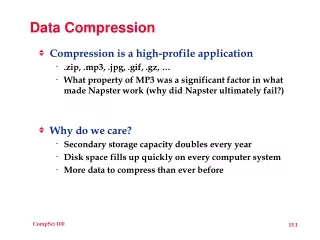
224 7-A 壓縮的哲學: (1) 利用資料的一致性,規則性,與可預測性 (exploit redundancies and predictability, find the compact or sparse representation) (2) 通常而言,若可以用比較精簡的自然語言來描述一個東西,那麼也就越能夠對這個東西作壓縮 Q: 最古老的壓縮技術是什麼? (3) 資料越一致,代表統計特性越集中 包括Fourier transform domain, histogram, eigenvalue ……….. 等方面的集中度
226 思考:如何對以下的資料作壓縮 Article: Song: Voice: Cartoon: Compression: Original signal Compact representation + residual information
7-B Compression for Images 影像的「一致性」: Space domain: 每一點的值,會和相鄰的點的值非常接近 F[m, n+1] F[m, n], F[m+1, n] F[m, n] Frequency domain: 大多集中在 低頻 的地方。
228 Lena Image 在 space domain 上的一致性
229 Histogram: 一個 vector 或一個 matrix 當中,有多少點會等於某一個值 例如:x[n] = [1 2 3 4 4 5 5 3 5 5 4] 則 x[n] 的 histogram 為 h[1] = 1, h[2] = 1, h[3] = 2, h[4] = 3, h[5] = 4
230 Lena Image 頻譜 (frequency domain) 的一致性 L[m, n] |fft2(L[m, n])|
231 7.C JPEG Standard Process of JPEG Image Compression Image JPEGfile 88 DCT AC係數 Zigzag Scan HuffmanCoding 4:2:2 or 4:2:0 量子化 8 × 8 (切成blocks) DC係數 差分編碼 HuffmanCoding 量子化表 檔頭 • 主要用到三個技術:(1) 4:2:2 or 4:2:0 (和 space domain 的一致性相關) • (2) 8 8 DCT (和 frequency domain 的一致性相關) • (3) Huffman coding (和 lossless 編碼技術相關)
232 JPEG: 影像編碼的國際標準 全名: Joint Photographic Experts Group JPEG 官方網站: http://www.jpeg.org/ 參考論文:G. K. Wallace, “The JPEG still picture compression standard,” IEEE Transactions on Consumer Electronics, vol. 38, issue 1, pp. 18-34, 1992. JPEG 的 FAQ 網站: http://www.faqs.org/faqs/jpeg-faq/ JPEG 的 免費 C 語言程式碼: http://opensource.apple.com/source/WebCore/WebCore-1C25/platform/image-decoders/jpeg/ 一般的彩色影像,可以壓縮 12~20 偣。 簡單的影像甚至可以壓縮超過 20 倍。
233 壓縮的技術分成兩種 lossy compression techniques 無法完全重建原來的資料 Examples: DFT, DCT, KLT (with quantization and truncation), 4:2:2 or 4:2:0, polynomial approximation 壓縮率較高 lossless compression techniques 可以完全重建原來的資料 Examples: binary coding, Huffman coding, arithmetic coding, Golomb coding 壓縮率較低
234 7-D 4:2:2 and 4:2:0 R: red, G: green, B: blue Y: 亮度, Cb: 0.565(BY), Cr: 0.713(RY), 4 : 4 : 4 4 : 2 : 2 4 : 2 : 0 Y Y Y Cb Cb Cb Cr Cr Cr
235 24 bits/pixel 16 bits/pixel 12 bits/pixel 同樣使資料量省一半,但影像起來和原來差不多 還原時,用 interpolation 的方式
236 原圖 直接在縱軸取一半的pixels 再還原
237 4 : 2: 2 4 : 2: 0
238 7-E Lossy Compression Techniques -- KLT 複習:DFT 的優缺點 • Karhunen-Loeve Transform (KLT) • (or named Principal component analysis-PCA) • 經過轉換後,能夠將影像的能量分佈變得最為集中 1-D Case K[u, n] = en[u] (K = [e0, e1, e2, ….., eN1] en為 covariance matrix C 的 eigenvector mean C[m, n] corr: correlation corr(x[m], x[n]) =
239 KLT 的理論基礎: 經過 KLT 之後,當 u1 u2時,X[u1] 和 X[u2] 之間的 correlation 必需近於零 (即 decorrelation) 即 corr(X[u1], X[u2]) 所以 Since if for all u The above equation can be simplified as:
240 Note that is the (u1, u2)th entry of E{XXT} where Since where K is the KLT matrix where C is the covariance matrix and corr(x[m], x[n]) = To make when u1 u2 should be a diagonal matrix Therefore, the KLT transform matrix K should diagonalize C. That is, the columns of K are the eigenvectors of C.
241 2-D Case KLT 缺點: dependent on image (不實際,需一並記錄 transform matrix)
242 7-F Lossy Compression Techniques -- DCT DCT: Discrete Cosine Transform C[0] = , C[u] = 1 for u 0 IDCT: inverse discrete Cosine transform 對於大部分的影像而言, DCT 能夠近似 KLT (near optimal) 尤其是當 corr{f[m, n], f[m+, n+]} = , 1時 有 fast algorithm Advantage: (1) independent of the input (2) near optimal (3) real output
243 DFT for Lena image DCT for Lena image Comparing with the DFT: (1) 能量更為集中 (2) Real output (3) 一樣都有 fast algorithm
244 左圖:將 DFT,DCT 各點能量(開根號)由大到小排序 右圖:累積能量 Energy concentration at low frequencies: KLT > DCT > DFT
245 通常,我們將影像切成 8 8 的方格作DCT Why: image 8 x 8 方格
246 References [1] W. D. Ray and R. M. Driver, “Further decomposition of the Karhunen-Loeve series representation of a stationary random process,” IEEE Trans. Inf. Theory, vol. 16, no. 6, pp. 663-668, Nov. 1970. [2] N. Ahmed, T. Natarajan, and K. R. Rao, “Discrete cosine transform,” IEEE Trans. Comput., vol. C-23, pp. 90-93, Jan 1974. [3] K. R. Rao and P. Yip, Discrete Cosine Transform, Algorithms, Advantage, Applications, New York: Academic, 1990.
247 附錄八:新的相似度測量工具:結構相似度 Structural Similarity (SSIM) 傳統量測兩個信號 (including images, videos, and vocal signals) 之間相似度的方式: (1) maximal error (2) mean square error (MSE) (3) normalized mean square error (NMSE) (4) normalized root mean square error (NRMSE)
然而,MSE 和 NRMSE 雖然在理論上是合理的,但卻無法反應出實際上兩個信號之間的相似度 例如:以下這三張圖 圖三 圖一 圖二 圖三 = 圖一 × 0.5 + 255.5 × 0.5 照理來說,圖一和圖三較相近 然而,圖一和圖二之間的 NRMSE 為 0.4411 圖一和圖三之間的 NRMSE 為 0.4460
(5) Structural Similarity (SSIM) 有鑑於 MSE 和 PSNR 無法完全反應人類視覺上所感受的誤差,在 2004 年被提出來的新的誤差測量方法 x, y: means of x and y x2, y2: variances of x and y xy: covariance of x and y c1, c2: adjustable constants L: the maximal possible value of x the minimal possible value of x Z. Wang, A. C. Bovik, H. R. Sheikh, and E. P. Simoncelli, “Image quality assessment: from error visibility to structural similarity,” IEEE Trans. Image Processing, vol. 13, no. 4, pp. 600−612, Apr. 2004.
若使用 SSIM,且前頁的 c1, c2皆選為 1 圖一、圖二之間的 SSIM 為 0.1040 圖一、圖三之間的 SSIM 為 0.7720 反應出了圖一、圖三之間確實有很高的相似度
其他幾個用 MSE 和 NRMSE 無法看出相似度,但是可以用 SSIM 看出相似度的情形 影子 shadow 圖四 圖五 NRMSE = 0.4521 (大於圖一、圖二之間的 NRMSE) SSIM = 0.6010
底片 the negative of a photo 圖六 圖七 圖七 = 255 -圖六 NRMSE = 0.5616 (大於圖一、圖二之間的 NRMSE) SSIM = -0.8367 (高度負相關)
同形,但亮度不同 (Same shape but different intensity) 圖八 圖九 NRMSE = 0.4978 (大於圖一、圖二之間的 NRMSE) SSIM = 0.7333
思考:對於 vocal signal (聲音信號而言) MSE 和 NRMSE 是否真的能反應出兩個信號的相似度? 為什麼?