Download
1 / 34
350 likes | 834 Vues
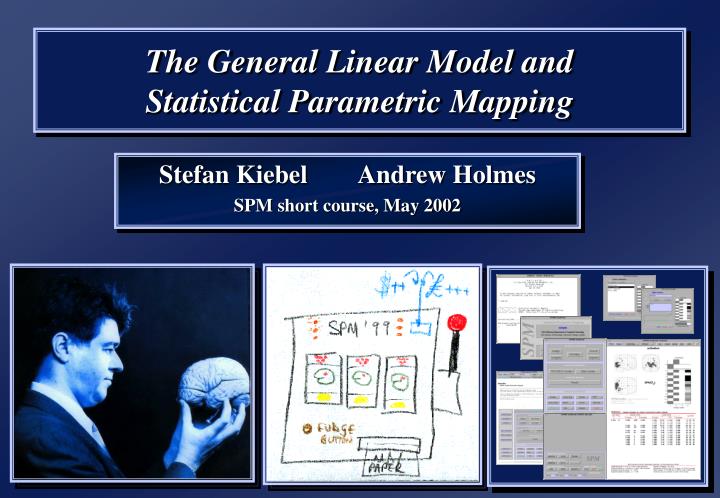
The General Linear Model and Statistical Parametric Mapping. Stefan Kiebel Andrew Holmes SPM short course, May 2002. ?. SPM key concepts. …a voxel by voxel hypothesis testing approach reliably identify regions showing a significant experimental effect of interest Key concepts

E N D
The General Linear Model andStatistical Parametric Mapping Stefan Kiebel Andrew Holmes SPM short course, May 2002
? SPM key concepts... …a voxel by voxel hypothesis testing approach • reliably identify regions showing a significant experimental effect of interest • Key concepts • Type I error • significance test at each voxel • Parametric statistics • parametric model for voxel data, test model parameters • No exact prior anatomical hypothesis • multiple comparisons • Statistical Parametric Mapping • General Linear Model • Theory of continuous random fields
Overview… …a voxel by voxel hypothesis testing approach • reliably identify regions showing a significant experimental effect of interest • The General linear model & Statistical Parametric Mapping • General Linear Model • models & design matrices • model estimation • Generalised Linear Model • serial correlations • variance components • Contrasts & Statistic images • Statistical Parametric Maps – SPMs • Global effects • Model selection
image data parameter estimates designmatrix kernel • General Linear Model • model fitting • statistic image realignment &motioncorrection random field theory smoothing normalisation StatisticalParametric Map anatomicalreference corrected p-values
Epoch fMRI • 7s RT – interscan interval • 84 scans – images 16–99 • 1 session • 1 condition/trial: words • Deterministic design: Fixed SOA of 12 scans (42s) • Epoch design • First trial at time 6 scans, 6 scans / words epoch SPM parameters(event terminology) (50, -40, 8) — Primary Auditory Cortex Example epoch fMRI activation dataset:Auditory stimulation • Single subject • RH male • Conditions • Passive word listening • Bisyllabic nouns • 60wpm • against rest • Epoch fMRI • rest & words • epochs of 6 scans • 42 second epochs • 7 BA cycles experiment was 8 cycles: first pair of blocks dropped • BABABABABABABA • last 84 scans of experiment images 16–99 • ~10 minutes scanning time seconds
Voxel by voxel statistics… model specification parameter estimation hypothesis statistic statistic image or SPM f MRI time series voxel time series
Voxel statistics… • parametric • one sample t-test • two sample t-test • paired t-test • Anova • AnCova • correlation • linear regression • multiple regression • F-tests • etc… • non-parametric? SnPM all cases of theGeneral Linear Model assume normality to account for serial correlations: Generalised Linear Model
…e.g. two-sample t-test? t-statistic imageSPM{t} Image intensity compares size of effect to its error standard deviation • standard t-test assumes independenceignores temporal autocorrelation! voxel time series
Regression example… Ys = + af(ts)+ s f(ts) = 0 or 1 s ~ N(0,2) = + a + error • t-statistic for H0: a= 0 • correlation:test H0: = 0 equivalent totest H0: a = 0 • two-sample t-test: test H0: 0 = 1equivalent totest H0: a = 0 • can extend to account fortemporal autocorrelation! voxel time series box-car reference function
…revisited = + a + error Ys 1 a f(ts) s = + +
General Linear Model… • fMRI time series: Y1 ,…,Ys ,…,YN • acquired at times t1,…,ts,…,tN • Model: Linear combination of basis functions • Ys = 1f 1(ts ) + …+lf l(ts ) + … +Lf L(ts ) + s • f l (.):basis functions • “reference waveforms” • dummy variables • l: parameters(fixed effects) • amplitudes of basis functions (regression slopes) • s: residual errors: s ~ N(0,2) • identically distributed • independent, or serially correlated (Generalised Linear Model GLM)
Y1f 1(t1) … f l(t1 ) … f L(t1 )11 :: … : … : : : Ys = f 1(ts ) … f l(ts ) … f L(ts )l + s ::… :… :: : YNf 1(tN ) … f l(tN ) … f L(tN )LN Y = X×b + e Design matrix formulation… Ys = 1f 1(ts ) + …+lf l(ts ) + … +Lf L(ts ) + ss = 1, …,N Y1 = 1f 1(t1) +…+lf l(t1 ) +…+Lf L(t1 ) + 1 : :: ::: :: Ys = 1f 1(ts ) +…+ lf l(ts ) +…+Lf L(ts ) + s : ::::::: YN = 1f 1(tN ) +…+lf l(tN ) +…+Lf L(tN ) + N vector of parameters error vector design matrix data vector Y=X×b +e N 1NL L 1N 1
Box-car regression… (revisited) = + a + error Ys 1 a f(ts) s = + +
Box car regression: design matrix… data vector (voxel time series) parameters error vector design matrix a = + Y = X +
Low frequency nuisance effects… • Drifts • physical • physiological • Aliased high frequency effects • cardiac (~1 Hz) • respiratory (~0.25 Hz) • Discrete cosine transform basis functions • r = 1,…,R • Rcut-off period
…design matrix parameters error vector design matrix data vector a m 3 4 5 6 7 8 9 = + = + Y X
^ a Y ^ m x ^ ^ Y1x11ae1 Y2 = x21 + e2 Y3x31me3 Y = Xb + e ^ ^ ^ Example: a line through 3 points… simple linear regression parameter estimates m&a fitted values Y1 ,Y2 ,Y3 residuals e1 , e2 , e3 Yi = axi + m + eii = 1,2,3 (x2, Y2) 1 (x3, Y3) Y1 = ax1 + m × 1 + e1 Y2 = ax2 + m × 1 + e2 Y3 = ax3 + m × 1 + e3 (x1, Y1) dummy variables
x11 Y = ax2 + m1 + e x31 Y= axa + mxm + e Geometrical perspective… (Y1, Y2, Y3) Y (x1,x2, x3) xa (1,1,1) xm O design space
^ Y ^ a xa ^ m xm ^ ^ ^ (Y1,Y2,Y3) Estimation, geometrically… (Y1, Y2, Y3) Y e = (e1,e2,e3)T xa xm design space
Estimation, formally… Consider parameter estimates Giving fitted values Residuals Residual sum of squares Minimised when …but this is the lth row of (obviously!) so the least squares estimates satisfy the normal equations giving
a xa ^ ^ m xm ^ ^ ^ (Y1,Y2,Y3) Inference, geometrically… Inference, geometrically… model: Yi = axi + m + ei null hypothesis: e.g.H0: a = 0 (zero slope…) i.e.does xa explain anything?(after xm) (Y1, Y2, Y3) Y e = (e1,e2,e3)T xa xm design space
Inference, formally… For any linear compound of the parameter estimates: Further (independently): So hypotheses can be assessed using: a Student’s t statistic, giving an SPM{t} Suppose the model can be partitioned… “Extra sum-of-squares”
Y = X + ^ Multivariate perspective… voxels ? ? = + parameters design matrix errors data matrix scans s2 variance parameterestimates • estimate residuals estimated variance = estimatedcomponentfields “Image regression”
fMRI box car example… parameters error vector design matrix data vector a m 3 4 5 6 7 8 9 = + Y = X +
…fitted raw fMRI time series adjusted for global & low Hz effects fitted box-car scaled for global changes fitted “high-pass filter” residuals
hæmodynamic response power spectrum • Drifts • physical • physiological • Aliased high frequency effects e.g. • cardiac (~1 Hz) • respiratory (~0.25 Hz)
Serial correlations... Y = Xb+ ee ~ N(0,s2V)–intrinsic autocorrelationV Problem: Estimate s2Vat each voxel and make inference about cTb Model: Model Vas linear combination of mvariance components V= l1 Q1 + l2 Q2 + … + lm Qm Assumptions: Vis the same at each voxel s2is different at each voxel Example: For one fMRI session, use 2 variance components. Choice of Q1and Q2motivated by autoregressive model of order 1 plus white noise (AR(1)+wn) Q1 Q2
Serial correlations…estimation Estimation: b = (XTX)–XTY – unbiased, ordinary least squares estimate Compute sample covariance matrix of data at all activated voxels: CY = SkYk YkT /K Important: Data Yk must be high-pass filtered. Model CY as CY = XbbTXT + SliQi and estimate hyperparameters li using Restricted Maximum Likelihood (ReML) Estimate VbyV= N SliQi /trace(SliQi ) Estimate s2 at each voxel in the usual way by s2 = (RY) T(RY) / trace(R V)– unbiased where R = I – X(XTX)–X ^ ^ ^ CY ^ CY ^
Serial correlations…inference Inference: To test null hypothesis cTb= 0, compute t-value by dividing size of effect by its standard deviation: t =cTb/ std[cTb] where std[cTb] = sqrt(s2c'(X TX)–XTVX(XTX)–c ) … but … std[cTb]is not a c2variable because of V Find approximating c2distribution using Satterthwaite approximation: Var[s2] = 2s4 trace(R V R V) / trace(R V)2 n = 2E[s2]2/Var[s2] = trace(RV)2/ trace(RVRV)– effective degrees of freedon • Worsley & Friston (1995) “Analysis of fMRI time series revisited – again” Use t-distribution with n degrees of freedom to compute p-value for t ^ ^ ^ ^ ^
Inference — contrasts — SPM{t} is there an effect of interest after other modelled effects have been taken into account contrast— linear combination of parameters: cT c = +1 0 0 0 0 0 0 0 t-test H0: cT = 0 e.g.activation: box-car amplitude > 0 ? contrast ofestimatedparameters T = varianceestimate SPM{t} correct variance estimate & degrees of freedom for temporal autocorrelation
Inference — F-tests — SPM{F} is there an effect of interest after other modelled effects have been taken into account multiple linear hypotheses 0 0 1 0 0 0 0 00 0 0 1 0 0 0 00 0 0 0 1 0 0 00 0 0 0 0 1 0 00 0 0 0 0 0 1 00 0 0 0 0 0 0 1 H0: cT = 0 c = e.g.Does HPF basis set model anything ? additionalvarianceaccounted forby effects ofinterest F = errorvarianceestimate SPM{F} correct variance estimate & degrees of freedom for temporal autocorrelation H0: 2 = 0 X2()
Conclusions… • General Linear Model • (simple) standard statistical technique • temporal autocorrelation – a Generalised Linear Model • single general framework for many statistical analyses • flexible modelling basis functions • design matrix visually characterizes model • fit data with combinations of columns of design matrix • statistical inference: contrasts… • t–tests: planned comparisons of the parameters • F–tests: general linear hypotheses, model comparison
Ch4 Ch3 The General Linear Model and Statistical Parametric Mapping Friston KJ, Holmes AP, Worsley KJ, Poline J-B, Frith CD, Frackowiak RSJ (1995)“Statistical parametric maps in functional imaging: A general linear approach”Human Brain Mapping 2:189-210 Worsley KJ & Friston KJ (1995)“Analysis of fMRI time series revisited — again” NeuroImage 2:173-181 Friston KJ, Josephs O, Zarahn E, Holmes AP, Poline J-B (1999) “To smooth or not to smooth”NeuroImage12: 196-208 Zarahn E, Aguirre GK, D'Esposito M (1997) “Empirical Analyses of BOLD fMRI Statistics” NeuroImage5:179-197 Aguirre GK, Zarahn E, D'Esposito M (1997) “Empirical Analyses of BOLD fMRI Statistics” NeuroImage 5:199-212 Holmes AP, Friston KJ (1998) “Generalisability, Random Effects & Population Inference” NeuroImage 7(4-2/3):S754