Download
1 / 22
220 likes | 334 Vues
Spectrum Analysis and PVan. analog-to-digital converter. samples. time-varying Fourier Analysis. Analyze the sound. amplitudes and phases. Resynthesize the sound. Additive Synthesis. resynthesized sound. recorded sound. Spectrum Analysis. Sound Analysis What are we going to do?

E N D
Spectrum Analysis and PVan
analog-to-digital converter samples time-varying Fourier Analysis • Analyze the sound amplitudes and phases • Resynthesize the sound Additive Synthesis resynthesized sound recorded sound Spectrum Analysis • Sound Analysis • What are we going to do? • Record a sound • Prepare the sound • Play a musical selection demonstrating the instrument design
pvan.exe interactive program for spectrum analysis analysis file with amplitudes and frequencies soundfile.pvn interactive program for spectrum display pvan.exe graphs of spectra Spectrum Analysis soundfile.wav PC.wav-format soundfile
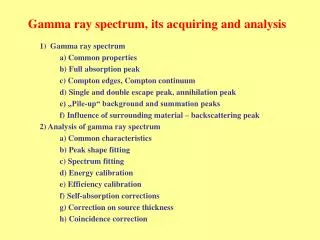
Synthetic Trumpet • Real musical instruments produce almost-harmonic sounds • The waveform of this synthetic trumpet repeats more exactly than that of a real instrument
Spectrum of a Sound • For any periodic waveform, we can find the spectrum of the waveform. • The spectrum is the relative amplitudes of the harmonics that make up the waveform. • The plural form of the word "spectrum" is "spectra."
Spectrum of a Sound • Example: amp1 = 1, amp2 = .5, and amp3 = .25, the spectrum = {1, .5, .25}. • The following graphs show the usual ways to represent the spectrum: Frequency Harmonic Number
Finding the Spectrum of a Sound • isolate one period of the waveform • Discrete Fourier Transform of the period. • These steps together are called spectrum analysis.
time-varying Fourier Analysis Fourier Coefficients Math amplitudes and phases Time-Varying Fourier Analysis sound • User specifies the fundamental frequency for ONE tone • Automatically finding the fundamental frequency is called pitch tracking — a current research problem • For example, for middle C: f1=261.6
Time-Varying Fourier Analysis • Construct a window function that spans two periods of the waveform. • The most commonly used windows are called Rectangular (basically no window), Hamming, Hanning, Kaiser and Blackman. • Except for the Rectangular window, most look like half a period of a sine wave:
Time-Varying Fourier Analysis • The window function isolates the samples of two periods so we can find the spectrum of the sound.
Time-Varying Fourier Analysis • The window function will smooth samples at the window endpoints to correct the inaccurate user-specified fundamental frequency. • For example, if the user estimates f1=261.6, but it really is 259 Hz.
Time-Varying Fourier Analysis • Samples are only non-zero in windowed region, and windowed samples are zero at endpoints.
Time-Varying Fourier Analysis • Apply window and Fourier Transform to successive blocks of windowed samples. • Slide blocks one period each time.
Spectrum Analysis • We analyze the tone (using the Fourier transform) to find out the strength of the harmonic partials • Here is a snapshot of a [i:37] trumpet tone one second after the start of the tone
Trumpet's First Harmonic • The trumpet's first harmonic fades in and out as shown in this amplitude envelope:
Spectra of Other Instruments • [i:38] English horn: pitch is E3, 164.8 Hertz
Spectra of Other Instruments • [i:39] tenor voice: pitch is G3, 192 Hertz
Spectra of Other Instruments • [i:40] guitar: pitch is A2, 110 Hertz
Spectra of Other Instruments • [i:41] pipa: pitch is G2, 98 Hertz
Spectra of Other Instruments • [i:42] cello: pitch is Ab3, 208 Hertz
Spectra of Other Instruments • [i:43] E-mu's synthesized cello: pitch is G2, 98 Hertz