Download
1 / 9
90 likes | 232 Vues
P O D # 8. Identify the outlier(s ) and how it effects the mean of the data:. basic. advanced. 18, 20, 20, 17, 2, 19, 36. 25, 30, 28, 23, 20, 83, 31. Mean (with): 34.3. Mean (with): 18.9 . Mean (w/o): 26.2. Mean (w/o): 18.8. P O D # 9. Is the graph below misleading? Why?. basic.

E N D
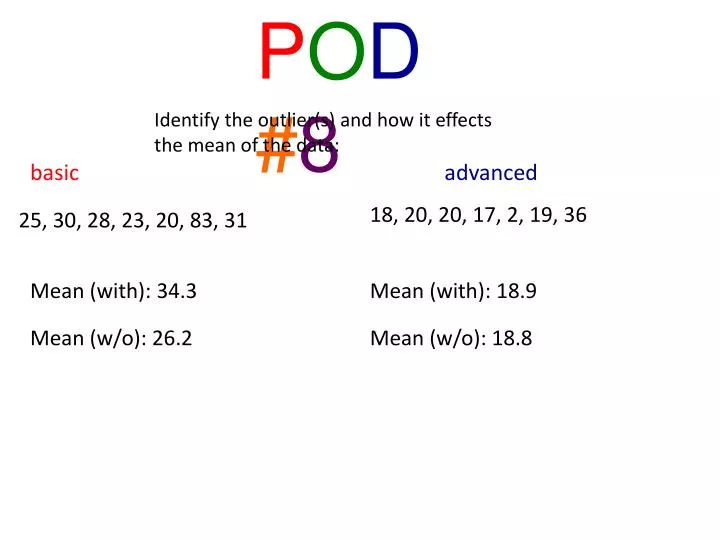
POD #8 Identify the outlier(s) and how it effects the mean of the data: basic advanced 18, 20, 20, 17, 2, 19, 36 25, 30, 28, 23, 20, 83, 31 Mean (with): 34.3 Mean (with): 18.9 Mean (w/o): 26.2 Mean (w/o): 18.8
POD #9 Is the graph below misleading? Why? basic
POD #10 basic advanced Is the sample below biased? Explain. Identify the population and the sample Graham wanted to find out what type of soft drink the students at his school preferred. He asked all of the kids in his class and tallied the results. 5 boys and 5 girls from each grade at Houston Elementary All of the students at Houston Elementary
Graphs let readers analyze data easily, but are sometimes made to influence conclusions by misrepresenting the data.
Which graph suggests a greater difference in the annual snowfall?
Statistics can also be used to influence conclusions. An amusement park boasts that the average height of their roller coasters is 170 ft. Explain how this might be misleading. Mean: 170 Median: 126 Mode: none
Explain why the graph below may be misleading The title and the bars show a drastic difference in home prices, however the actual difference is only $2,000.
Explain why the owners of “Cup of Joe” might think this graph is unfair to their business.