Download
1 / 35
350 likes | 466 Vues
Using GIS to Assess Parcel Suitability for Potential Park Locations. Matthew Mullenax, GISP Berkeley County Planning Commission. Study Background:. 2006 Census estimates list Berkeley County as one of 100 fastest growing counties in U.S.

E N D
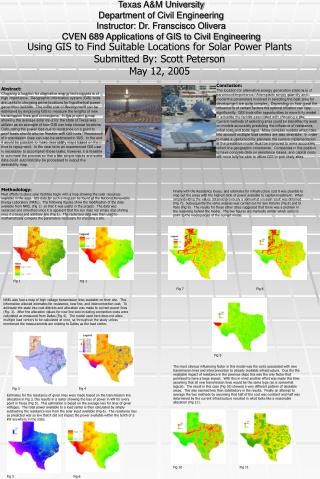
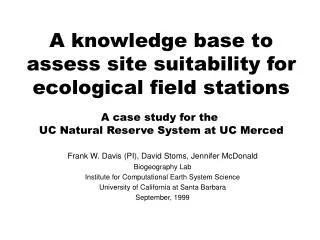
Using GIS to Assess Parcel Suitability for Potential Park Locations Matthew Mullenax, GISP Berkeley County Planning Commission
Study Background: • 2006 Census estimates list Berkeley County as one of 100 fastest growing counties in U.S. • Growth has had impact on variety of public services, notably parks and recreation. • Berkeley County looking to develop long-range strategy for park land acquisition. • GIS can be used to help locate potential park sites via suitability modeling. • Pilot project performed on Martinsburg, WV.
Suitability Modeling • A measure of the relative usefulness of a land unit for some given purpose. • Typically used to locate something. • If designed properly, the model results in potential locations being identified and assigned a relative suitability score for the activity. • Breaks a big problem down into smaller, easily-solved goals which are combined for a measure of suitability.
Suitability Modeling and GIS • Weighted combination is one method of suitability modeling.
Suitability Modeling and GIS • Weighted combination is one method of suitability modeling. • Weighted Sum Tool available with ESRI ArcGIS 9.2 Spatial Analyst extension license.
Suitability Modeling and GIS • Weighted combination is one method of suitability modeling. • Weighted Sum Tool available with ESRI ArcGIS 9.2 Spatial Analyst extension license. • Three major steps must be completed before running the tool: • Select evaluation or utility scale. • Set scale or suitability values for inputs. • Assign weights to inputs.
Building the model • Appropriate evaluation criteria: • Population • Existing parks • Roads
Determine suitability of each input • Population – high population is preferred • Existing parks – areas distant from existing parks preferred • Roads – close proximity to major roads is preferred
1. Select evaluation or utility scale • Evaluation or utility scale works to normalize all input raster datasets. • A linear scale of 1 to 9 by 1 has proven to be workable. • >9 values difficult to visually comprehend; <9 values can decrease sensitivity
Range of Suitability Values on Utility Scale: 1 = lowest suitability 2 = very low suitability 3 = low suitability 4 = moderately low suitability 5 = moderate suitability 6 = moderately high suitability 7 = high suitability 8 = very high suitability 9 = highest suitability
2. Set scale or suitability values for inputs. • The cells of each input raster in the analysis are assigned suitability values from the utility scale. • The assignment of suitability values for a single layer is called Single Utility Assignment (SUA).
Population input • Central Dispatch address locations • Perform Density calculation • Use Reclassify tool to assign suitability values on utility scale (1 to 9 by 1)
Set scale values for Population input 9 – 11 – 15 8 – 7.9 – 10 7 – 6.2 – 7.8 6 – 4.8 – 6.1 5 – 3.6 – 4.7 4 – 2.5 – 3.5 3 – 1.6 – 2.4 2 – 0.52 – 1.5 1 – 0 – 0.51 Reclassify
Existing Parks input • Existing Martinsburg parks (9) • Perform Distance calculation • Use Reclassify tool to assign suitability values on utility scale (1 to 9 by 1)
Set scale values for Parks input 9 – > 5280 feet 8 – 4621 - 5280 7 – 3961 - 4620 6 – 3301 - 3960 5 – 2641 - 3300 4 – 1981 - 2640 3 – 1321 - 1980 2 – 661 - 1320 1 – 0 – 660 Reclassify
Roads input • Major roads (Routes 9, 11, and 45, King and Queen Streets, Edwin Miller Boulevard, Tavern Road) • Perform Distance calculation • Use Reclassify tool to assign suitability values on utility scale (1 to 9 by 1)
Set scale values for Roads input 9 – 0 – 660 feet 8 – 661 – 1320 7 – 1321 – 1980 6 – 1981 – 2640 5 – 2641 – 3300 4 – 3301 – 3960 3 – 3961 – 4620 2 – 4621 – 5280 1 – > 5280 Reclassify
3. Assign weights to inputs • Each input is weighted, or assigned a percentage influence, based on its importance. • The total influence for all inputs must equal 100 percent. • Total Suitability = (criteria1 * weight1) + (criteria2 * weight2) + ... + (criterian * weightn)
3. Assign weights to inputs • Each input is weighted, or assigned a percentage influence, based on its importance. • The total influence for all inputs must equal 100 percent. • Total Suitability = (criteria1 * weight1) + (criteria2 * weight2) + ... + (criterian * weightn)
SUAs combined to create Multiple Utility Assignment (MUA) (10%) (45%) (45%)
Implementing the Suitability Map by Parcel Assessment • Parcel assessment conducted using Zonal Statistics as Table Tool.
Implementing the Suitability Map by Parcel Assessment • Parcel assessment conducted using Zonal Statistics as Table Tool. • Tool calculates a variety of statistics on values of a raster within the “zones” of another dataset.
Using Zonal Statistics as Table Tool • Zone Layer is Parcel data. • Value Raster is MUA. • Creates table of statistics joined to Parcel data by unique PIN#.
Parcel Assessment • Parcels mapped by MAX suitability value. • Use of MEAN causes smaller parcels to have higher values overall than larger parcels.
Parcel Assessment (cont’d) • Select all parcels with score > 6.75. • Five areas identified. • First area apartment complex adjacent to school playground & church ball field (Martin’s Landing). • Second area apartment complex in commercial area (Courthouse Apartments). • Third area in large, phased subdivision in recently annexed West Side area (The Gallery). • Fourth area apartment complex with playground (Fountainhead Apartments). • Fifth area Downtown.
Parcel Assessment (cont’d) • Inspect selected parcels ownership information, current use, etc. and determine feasibility. • If parcels unfeasible, run new query using next highest suitability values and re-perform inspection on newly selected parcels.
Study Limitations/Future Considerations • Spatial accuracy of Roads and Address inputs in few small areas. • Lack of separation between residential vs. non-residential addresses. • Parks layer does not include school, church, and/or subdivision improved open spaces. • County inholdings, right-of-ways, municipal boundary shape have potential to influence results. • Method of weight determination not overly rigorous. • Consider creating distance grid from all roads vs. only major roads.
Acknowledgements: • Steve Catlett Martinsburg-Berkeley County Parks & Recreation
Questions? • Matthew Mullenax, GISP GIS Coordinator Berkeley County Planning Commission 400 West Stephen Street, Suite 203 Martinsburg, WV 25401 PH - (304) 267-5107 FX - (304) 262-3127 mmullenax@berkeleycountycomm.org