Download
1 / 73
740 likes | 851 Vues
The Hot ISM. K.D.Kuntz The Henry Rowland Dept. of Physics The Johns Hopkins University and NASA/LHEA. What is the “Hot ISM”?. Not identifiably a SNR Bubbles and Super-bubbles (SN and groups of SN that have lost their identities) Galactic Halo (hot gas that was originally produced by SN)

E N D
The Hot ISM K.D.Kuntz The Henry Rowland Dept. of Physics The Johns Hopkins University and NASA/LHEA
What is the “Hot ISM”? • Not identifiably a SNR • Bubbles and Super-bubbles (SN and groups of SN that have lost their identities) • Galactic Halo (hot gas that was originally produced by SN) • IGM?
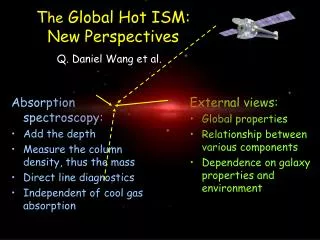
Why study the “Hot ISM”? Grand unified theories of the ISM • Contains bulk of the energy budget • SN primary mechanism for injecting energy A. McKee-Ostriker (1977) hot gas surrounds cool clouds (appearance of ISM determined by balance between shock heating and radiative cooling) B. Cox-Smith (1974) cool clouds surround network of hot tunnels and bubbles
Greyscale: Hα, Contours: X-ray Why study the “Hot ISM”? How much halo is there? A very important question for understanding enrichment of the IGM Q.D.Wang (2001) NGC 4631 Strongly star-forming galaxy
!!!WARNING!!! Galaxies are not like clusters of galaxies…. Typical virial temperatures ~ 106K but – Spitzer coronae not observed in the X-ray Benson et al. (2000) Toft et al. (2002) X-ray halos not observed except for strongly star-forming galaxies
Chandra image of M101 GALEX image of M101 • X-ray more associated with star-formation
Introductory Concepts The higher the energy, the further one can see!
Historical Background Soft X-ray (<2 keV) Astronomy: Bowyer, Field, Mack (1968) Bunner et al (1969) Henry et al (1969) ● Expected soft extrapolation of EG emission ● Expected to see emission absorbed by disk ● Surprised by extra emission component A new instrumental background?
Wisconsin Rocket Flights Large FOV (6 degrees) Anticorrelation Primarily thermal Copernicus - O VI
Contemporary thinking: Copernicus observed OVI in all directions OVI is emitted by gas at temperatures of a few ×105K, cooler than the 106K gas that emits the soft X-rays. Perhaps the OVI emitting gas is at the interface between the X-ray emitting gas and the surrounding, cool, neutral gas.
Three Models • Absorption required unreasonable clumping of the ISM required emission in excess of that expected from the extrapolation of the hard X-ray spectrum emission in Galactic plane not explained high-b shadows not seen B. Interspersed many of the same problems as Absorption but fit well with the McKee-Ostriker model C. Displacement fit well with optical picture of local ISM
Local ISM HI in the solar neighborhood is deficient Knapp (1975)
Local ISM Frisch & York (1983) determined the same thing with absorption line spectroscopy in the optical
The area around the sun is deficient in neutral cool material. This deficit has come to be known as “The Local Cavity”. The local region of X-ray emitting gas is now known as “The Local Hot Bubble”. The two things are not the same, but the Bubble must fit inside the Cavity (or else there would be detectable absorption of X-rays). In fact there are regions where the Bubble is much smaller than the Cavity and it is not clear what fills the gap.
Local ISM Juda (1991) LB is empty!
Because the Be band is much softer than the B band, it is far more sensitive to absorption. Therefore, since the Be/B ratio is the same everywhere in the sky, there can be very little absorption within the X-ray emitting region. This has also been demonstrated with UV observations of local white dwarfs.
ROSAT ROSAT solved the question just months after launch by observing the Draco molecular clouds at relatively high galactic latitude.
0.25 keV I100 ROSAT Shadows Left: map of column density, Right: X-rays, There really is emission from outside the disk!
MBM 12 Absorption Can Be Your Friend Itot=Ilocal+Idiste-τ Thus, by measuring the aborption due to a molecular cloud at a known distance, one can determine the amount of foreground emission.
0.25 keV Since MBM 12 casts almost no shadow at ¼ keV, all of the local emission must be closer than the cloud. 0.75 keV
Absorption Can Be Your Friend Given a sufficient dynamic range of absorbing column – can determine amount of emission behind and in front of absorption. If distance to absorption known – can place limits on the distance to the emission.
The ROSAT All-Sky Survey 0.25 keV I100~NH
The previous image was the ROSAT All-Sky Survey and a map of the neutral (absorbing) gas. One can use the anticorrelation of the two to map the local (Local Hot Bubble) and distant (Galactic Halo and IBM) emission.
Whole Sky Decomposition The top panels are Snowden’s map of the Galactic halo emission towards the galactic poles.
Whole Sky Decomposition Snowden’s image of the foreground (Local Hot Bubble ) emission from the ROSAT All-Sky Survey
Cross-sections of the Local Hot Bubble derived from the previous map. Note: irregular, smaller in the Galactic plane than towards the poles.
The ROSAT All-Sky Survey 0.75 keV 0.25 keV
Note: the strong emission towards the poles in the 0.25 keV map is due to BOTH extragalactic emission AND the extension of the Local Hot Bubble perpendicular to the Galactic disk.
Whole Sky Decomposition Map of the local Galactic disk
Note about the previous image: the X-ray emitting regions are not connected. The hot gas is not pervasive. The McKee-Ostriker model does not look like the local ISM. Now that we have a rough idea of the distribution of the local hot ISM, let’s take a more detailed look at some of its principal components.
Local Hot Bubble (LHB) Models: • Single SNR, Cox & Anderson (1982) • Reheating an old cavity with new SNR Smith & Cox (2001) • Adiabatic Expansion of hot gas into an old cavity, Breitschwerdt & Smutzler (2001) • Isolation of hot arm, Maiz-Apellaniz (2001)
Local Hot Bubble (LHB) The Size Problem: Path length proportional to Emission MBM 12 shadow sets distance scale MBM12 distance is changing! Hobbs (1986) 65pc (also Hipparchos) Luhman (2001) 275+/-65 pc Anderson (2002) 360+/-30 pc However, old scaling consistent with the newest measures of the local cavity, Sfeier (2001)
Local Hot Bubble (LHB) Sfeir et al’s map of the local cavity (thin lines) Snowdens’s map of the LHB (thick lines) The two are consistent.
Local Hot Bubble (LHB) The Pressure Problem: Hot Gas T~106 K, P/k~15000 cm-3 K Partially Ionized Cloudlets within LHB T~7500 K, P/k~1400-3600, N~1017-1018 Lallement, Jenkins (1992) Total column < few×1018, Hutchinson (1998)
Local Hot Bubble (LHB) The Spectrum Problem (1) Diffuse X-ray Spectrometer (DXS) energy range: 0.15-0.31 keV resolution: 4-14 eV Sanders et al. (2001) FOV of the instrument
DXS Spectrum of LHB (Sanders) Depleted models provide best fit, but not good Line identification questionable for many lines The Spectrum Problem (1) Diffuse X-ray Spectrometer (DXS) energy range: 0.15-0.31 keV resolution: 4-14 eV Sanders et al. (2001)
Local Hot Bubble (LHB) The Spectrum Problem: Cosmic Hot Interstellar Plasma Spectrometer Hurwitz, Sasseen, & Sirk (2005) 106 K plasma should have Fe VII-Fe XII lines near 72 eV
Local Hot Bubble (LHB) CHIPS Spectrum contains almost no lines! The EM is tightly constrained, but not the temperature. Depletion helps, but only by a factor of a few.
Local Hot Bubble (LHB) The Spectrum Problem Bellm & Vaillancourt (2005) no depletion can make all of the data consistent depletion makes the data less inconsistent
Local Hot Bubble (LHB) The UV Problem: O VI emission, Shelton (2003) EM is too small for B&S model Allows only ~3 interfaces per LOS O VI absorption, Oegerle (2005) some components seen nearby, LHB wall is not seen! Does this mean hot gas does not exist in LHB? No, some must exist to produce O VII.
Local Hot Bubble (LHB) Models: • Single SNR, Cox & Anderson (1982) would produce too much O VI • Reheating an old cavity with new SNR Smith & Cox (2001) still viable • Adiabatic Expansion of hot gas into an old cavity, Breitschwerdt & Smutzler (2001) would produce too much O VI
(LHB) Solution? Charge Exchange Reactions: O+8 + H → O+7 + H++ ν Cause of “flaming comets”
(LHB) Solution? Charge Exchange Reactions: Source of the ROSAT “Long-Term Enhancements” and consistent with background seen towards the moon.
(LHB) Solution? Charge Exchange Reactions: X-rays due to interaction of solar wind with material in Earth’s Magnetosphere and with the ISM flowing through the solar system Since the solar wind is time variable, so is the X-ray emission.
(LHB) Solution? Time-variable lines due to solar wind (Snowden, Collier & Kuntz 2004)
Other Bubbles and Stuff Monogem Ring, Plucinsky et al (1996) nearby (300pc?) SNR log T~6.34 Eridion Bubble, Guo & Burrows (1995) log T~6.00-6.24 Thus: Bubbles are too soft to be seen with CXO Loop I Super-bubble log T~6.5, Willingale et al (2005) Galactic Bulge log T~6.6, Snowden et al (1997)
0.75 keV 0.25 keV Loop I Superbubble Galactic Bulge Eridion Bubble Monogem
Loop I Super-bubble By careful study of absorption, Snowden showed that the Loop I superbubble emission is in front of the emission from the Galactic bulge
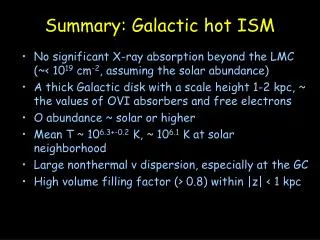
The Galactic Halo From Kuntz & Snowden (2000) The halo has two thermal components: 1. Soft & patchy, log T~6.05 Galactic chimney effluvia? 2. Hard & uniform, log T~6.45 Hydrostatic halo? Or WHIM/WHIGM? Had the right temperature and strength to be the Warm-Hot Intergalactic Medium