Download
1 / 51
520 likes | 680 Vues
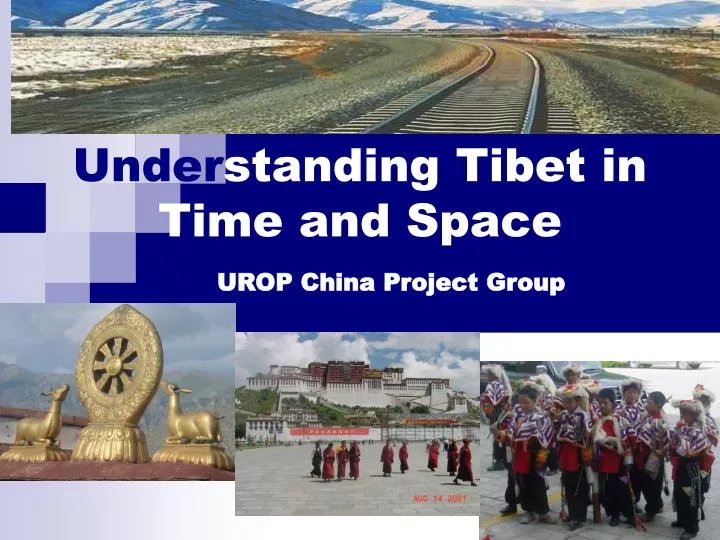
Under standing Tibet in Time and Space. UROP China Project Group. OUTLINE. 1. Introduction 2. Natural Resources 3. Population 4. Culture and Education 5. Economy 6. Environment 7. Data Sources. 1. Introduction. 1.1 Tibet’s Landscape. Tibet – the Last Clean Land on the Earth.

E N D
Understanding Tibet in Time and Space UROP China Project Group
OUTLINE • 1. Introduction • 2. Natural Resources • 3. Population • 4. Culture and Education • 5. Economy • 6. Environment • 7. Data Sources
1.1 Tibet’s Landscape Tibet – the Last Clean Land on the Earth
Tibet is in plateau region and located at the west of Yangtze river watershed It is home to indigenous Tibetan and people from other 43 ethnic groups 1.2 Tibet’s Location
1.3 Some Facts about Tibet • Language • Tibetic Language with numerous dialects • Area size • 12.284 million sq meters • Population • 2.81 million (at the end of 2006) • Capital City • Lhasa • Religion • Tibetan Buddhism • Islam • Elevation • Average 4,900 meters (app. 16,000 ft)
1.4 Tibet’s History • Largely Isolated from other parts of China until the1950s • Has never been recognized by any country as an independent state (Veek, Pannell, Smith and Huang, 2008. China’s Geography) In 1700s and 1800s, the Chinese government appointed Ambans, or Residents, as the Tibet Governors In 1914, Simla Convention signed by Tibet and British India with Tibet as an autonomous region of China, which, however, has never been accepted by the Chinese government Before 1950, political and religious power was centralized in the hand of the DalaiLama, with the best agricultural land of Tibet controlled by Lamaist monasteries In 1950, the new Chinese government took control of Tibet In 1954, China and India signed a treaty that accepted Chinese sovereignty in Tibet In 1959, 14th Dalai Lama Fled to India after Lhasa Rebellion was suppressed by the Chinese government In 1979, China opened Tibet to foreign tourists On July 1st, 2006, Qing-Zang railway (1956 km) started the operation
1.5 Changes in Tibet Changes in Geography: Qing-Zang Railway (Qinghai Lake) (Gomud) (Mt.Kunlun) (Xining) (Budongquan) (Kekexili) (Wudaolian) (Tuotuo River) (Tuotuo River) (Mt.Tanggula) (Anduo) (Naqiu) (Nam Lake) (Mt. Nianqingtanggula) (Dangxiong) (Yangbajin) (Lhasa)
Tibet has… World’s greatest alpine plants Plateau-dwelling wild animals Prime source of Asia's great rivers Loftiest mountains World's most extensive plateau Ancient forests Deep untouched valleys 2.1 Rich in Natural Resources
3.1 Population of Tibet • Total population : approximately 2.81 million in 2006 • Population Density : 2.03 people per sq km in average • Age Distribution: 31.2% (0-14 years old), 64% (14-65 years old), 4.8% (65-above) • Dependency Ratio : 56.1% (Yangtze River average = 44.2%) • Annual Population Growth: 11.7‰, with birth rate of 17.4‰ and death rate of 5.7‰ in 2006 • Agricultural Population: 91.6%, highest among Yangtze River regions • Urban Population: 8.4%, lowest among Yangtze River regions
Total Population by Counties Population Per County of Tibet in 2000 (Unit: Person)
4.1 Tibetan Ethnicity Consists of 44 ethnic groups: % of ethnic population in Tibet among all of their population in China: 95% Monba (门巴族) 91%Lhoba (珞巴族) 45%Tibetan(藏族) • 93% Tibetan (藏族) • 6.1%Han (汉族)
4.2 Tibet Religion • Bön • Tibetan Buddhism • Nyingma • Kagyu • Sakya • Gelug • Tibetan Muslims (Kachee) Tangka 唐卡艺术 扎什伦布寺,日喀则市,1447- Tashilhunpo Monastery, Shigatse
4.3 Education • All expenses of boarding schools up to 9 years education are covered by the government
Average Years at Schools by Counties Average years at schools per county of Tibet in 2000 (Unit: Year)
Illiterate Population for Age 15 and Over Illiterate population for age 15 and over per county of Tibet in 2000 (Unit: Year)
5.2 Industry of Tibet • Modern industries in Tibet were close to non-existent prior to 1950 • Industrial development finally surfaced in the late 1950s with the opening of several factories in Lhasa and the establishment of a hydroelectric power facility • By 1980, the economy was centered around tourism and agricultural industries • Has seen gradual industrial growth during the late 20th Century, but still is one of the least prosperous provinces in China
5.3 Agriculture of Tibet • Limited, but developing forestry • Important crops • Barley • Wheat • Beans • Dairy Products
Agricultural Regions Employed population in Farming, Forestry, Animal Husbandry and Fishery per county of Tibet in 2000 (Unit: Person)
6.1 Environmental Impact The increase in passenger traffic will result in greater tourism and economic activity on the Tibetan Plateau. The railway would make coal, which is not produced in Tibet, an affordable replacement. However, the increase in fuel combustion due to increased human activity in an already-thin atmosphere may affect the long term health of the local population.
6.2 Environmental Concerns Grassland Degradation Endangered Wildlife Deforestation Potential Water Pollution
ENDANGERED BIRDS • Wood snipe • Rufous-necked hornbill • Black-tailed godwit • Golden eagle • Saker falcon • Spoonbill • Brahminy kite • Tibetan patridege • Tibetan sand grouse • Tibetan eared phesant • Snow patridge • Sclater’s monal pheasant • Tibetan snowcock • Satyr tragopan Black crane • Red-headed trogon • Koslow bunting • Calandra lark • Blyth’s Tragopan
ENDANGERED MAMMALS OF TIBET • Takin • Tibetan Antelope • Otter • Tibetan Wild Yak • Blue-sheep (bhharal) • Ibex • Red panda • Siberian Tiger • White-lipped Deer • Rhesus macaque • Shou (Red Deer) • Snow leopard • Himalayan Tahr • Black bear • Goral • Kyang (Tibetan wild ass) • Lynx • Tibetan Argali Sheep
6.3 Global Climatic Effects Tibet influences the global weather pattern by affecting the flow of jet streams over the Tibetan Plateau. Loss of forest and grassland cover of the plateau will affect pacific typhoons and also cause the El Nino effect which altogether affect the weather pattern of Europe, North America, Peru, India and China.
Challenges under Global Changes Cultural diversity Biological diversity Globalization of economy Technology innovation Climate changes
7.1 Data Sources for Tibet Studies • Government Statistics • Survey Data (rural, urban, enterprise, market) • Census Data (population, basic units, agriculture) • GIS Data (administrative boundaries, roads, rivers, land, elevation,….) • Remote Sensing Data
7.2 Tibet Census Data with GIS Maps - The 2000 Tibet Township Population Census Data with GIS Maps - The 2000 Tibet County Population Census Data with GIS maps - The 2000 Tibet Province Population Census Data with GIS Maps - The Tibet Historical Population Census Data with GIS Maps (1953, 1964, 1982, 1990, 2000) - Tibet 2000 Population Data with One sq km GIS Maps - Tibet 2004 Economic Census Data with ZIP Maps
7.3 Population and Economic Census Data> 2,000 demographic variables in 2000 population Census Geographical Levels: Country | Province | Prefecture | County | Township | 1 sq km Grid 2004 Economic Census: • Employment • Revenue • Industries • Products • Ownerships 2000 Population Census: • General Information • Nationalities • Age Structure • Household Structure • Education • Fertility • Deaths • Marriage • Migration • Housing Status • Industries and Occupations
7.4 Historical Population Census Data (1953,1962,1982,1990,2000) Census 1953 Census 1962 Census 1982 Census 1990 Census 2000
7.5 China Data Online • Tibet STATISTICS • Monthly Statistics • National Statistics • Provincial Statistics • City Statistics • County Statistics • Industrial Data • Statistics on Map • Statistical Yearbooks • CENSUS DATA • Economic Census Data • Industrial Census Data • Population Census (82,90,00,05)
http://Chinadatacenter.org http://Chinadataonline.org
References • Veek, Pannell, Smith and Huang. 2008. China’s Geography, Rowman & Littlefield Publishers, Inc. • Tibet: The Truth (video) • www.wikipedia.org • www.chinadataonline.org • www.cnn.com • www.yahoo.co.kr • www.sherig.org • www.tchrd.org • www.images.google.com • http://www.cctv.com/specials/xizang • http://news.xinhuanet.com