Download

1 / 26
260 likes | 327 Vues
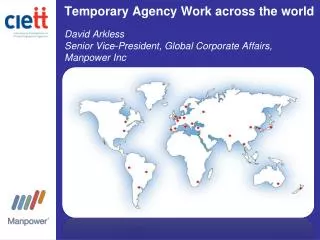
Private employment services’ contribution to more efficient labour markets. James Gribben, Ciett Communications and Economic Affairs Advisor. Ciett at a glance. Founded in 1967 Gathers 176,000 branches and employ more than 10 million agency (TES) workers on a daily average (FTEs)

E N D
Private employment services’ contribution to more efficient labour markets James Gribben, Ciett Communications and EconomicAffairsAdvisor
Ciett at a glance • Founded in 1967 • Gathers 176,000 branches and employ more than 10 million agency (TES) workers on a daily average (FTEs) • Only association representing agency work: • at large (brings together 49 countries) • in its diversity (uniting 9 of the largest multinational staffing companies as well as hundreds of thousands of SMEs) • Recognised as such by international organisations (e.g. ILO, European Union, OECD), key stakeholders (e.g. IOE, BusinessEurope, ITUC) and national governments • Represents the full spectrum of HR services: temporary agency work, recruitment, interim management, executive search, outplacement, training
Key messages of Adapting to Change • The world is undergoing fundamental structural shifts • Globalization • Volatility • Demographic evolution • Sectoral shifts • New attitudes to work • This brings a new set of challenges to the labour market • Persistent high level of unemployment • Stronger segmentation of the labour market • Increasing mismatch between supply and demand of skills • Unpredictability and lack of visibility • New forms of labour contractual arrangements not well regulated nor organised • The role of labour market intermediaries to enable change is crucial • Private employment services industry offers solutions to these challenges Source: Ciett RfP, BCG/Ciett discussion
Rise in firm instability clearly visible Expectations-based Fundamental-based Market cap volatility Revenue volatility Operating margin volatility 5-year firm op margin volatility (%)2 5-year firm mkt cap growth volatility (%)1 5-year firm revenue growth volatility (%)2 4 60 25 50 20 3 40 15 2 30 10 20 5 1 1960 1970 1980 1990 2000 2010 1960 1970 1980 1990 2000 2010 1960 1970 1980 1990 2000 2010 Increase 1990-2010 vs. 1960-1979 50% 26% 32% 1. Weighted average across all firms, based on market cap 2. Weighted average across all firms, based on revenue Note: Based on all public U.S. companies
Providing flexibility is main reason of use of PrES 1 Adaptation to change Main reasons to make greater use of AW Can respond quicker to business demands 76% Desire for greater flexibility 65% Can try out potential permanent hire 52% Desire to keep fixed cost low 35% Uncertainty over payroll taxes 9% Uncertainty over medical costs 4% Other 4% 0 20 40 60 80 (%) Besides the overarching topic of flexibility companies also use AW to hire permanent staff (extended trial period) Source: Morgan Stanley Research (interviews with 200 HR managers in the US and Europe)
Companies using agency work accelerate faster out of downturnGermany: higher revenue growth when agency work is used 1 Adaptation to change Revenue growth 2009 – 2010 20 Using AW Not using AW 16% 15% 15 13% 13% 11% 11% 11% 10% 10% 10% 10 8% 8% 7% 7% 6% 6% 6% 5% 5% 5% 5 0 Small (< 50 employees) Medium and large (> 50 employees) Industry Service1 No export activities With export activities No R&D spendings < 5% of revenue > 5% of revenue TOTAL Company size Sector Export activity R&D expenditures Ability to react quickly results in higher revenue growth 1. Including construction and other sectors Source: IW Consult GmbH study "Zeitarbeit in Deutschland" 2011
Agency work a key lever in creating flexibility 1 Adaptation to change Critical to managing seasonality and economic cyclicality ... ... as well as allowing flexibility for workers who need it, i.e. sick or maternity leave 75% of companies are using AW to deal with fluctuations e.g. in demand Share of companies using AW to absorb activity fluctuations (%, 2009) Share of companies using AW to replace absent permanent staff (%, 2009) Half of companies temporarily replace absent permanent staff with the help of AW 100 100 80 87 65 80 Ø 76 60 69 49 46 Ø 49 60 49 40 35 40 20 20 0 0 Netherlands Germany Switzerland Sweden Netherlands Sweden Germany Switzerland Source: Ciett national reports
Agency work ensures job creation Most companies would not have created jobs without agency work 2 Reducing structural & frictional unemployment Alternatives to agency work Conclusions • 74% of companies do not consider hiring permanent workers an alternative to agency work • In 62% of the cases there would be no jobs created: companies chose internal flexibility or not to do the work % of responses (total = 101) 100 80 No job creation 62% 54% No substitution 74% 60 100% 8% 40 12% 20 26% 0 Total Internal flexibility Not do the work Other external flexibility solution Hire permanent workers Source: User organization survey, BCG analysis
Agency work helped reduce unemployment in ItalyRegulatory changes in favor of AW and their positive impact on the level of unemployment Reducing structural & frictional unemployment 2 Unemployment rate (%) AW penetration rate (%) 15 1.5 Unemployment rate TAW penetration rate Legal recognition of AW in Italy 1.0 10 0.5 Regulatory changes in favor of AW 5 0.0 1996 1997 1998 1999 2000 2001 2002 2003 2004 2005 2006 2007 2008 2009 Unemployment rate started to decline right after introduction of agency work work Source: OECD, Ciett national reports, GiGroup
PrES allow lower level of GDP growth needed to create jobsAnalysis of longer time series for Belgium GDP / employment year-on-year growth (quarterly, %) AW year-on-year growth (quarterly, %) 10 40 GDP AW Employment 5 20 0 0 -5 -20 Employment recovery AW recovery -10 -40 01/1991 03/1991 01/1992 03/1992 01/1993 03/1993 01/1994 03/1994 01/1995 03/1995 01/1996 03/1996 01/1997 03/1997 01/1998 03/1998 01/1999 03/1999 01/2000 03/2000 01/2001 03/2001 01/2002 03/2002 01/2003 03/2003 01/2004 03/2004 01/2005 03/2005 01/2006 03/2006 01/2007 03/2007 01/2008 03/2008 01/2009 03/2009 01/2010 03/2010 Agency work performs in line with GDP and starts significantly ahead of total employment Note: GDP YoY growth figures for 1995 estimated Source: federgon
The diversity of agency workers’ profiles increases labour market participation Driving down segmentation 3 Workers reentering the labour market Workers looking for a permanent job First time entrants Flex Professionals Students Senior workers (make money to fund studies and/or vacations) (work as temps after period of unemployment/maternity leave) (Second best choice but see AW a stepping stone) (enter the labour market and gain first work experience) (not looking for a permanent contract) (remain employed to get additional incomes)
Agency workers in South Africa are predominantly young 2 Reducing structural & frictional unemployment
Agency work provides needed opportunity for young people Agency workers under 25 years strongly overrepresented in agency work vs. total labour market in all countries Source: Ciett national reports, Euromonitor, ILO Kilm
Agency work provides a stepping stone into employmentBringing people into employment reduces the segmentation of the labour market Driving down segmentation 3 Population (%) 100 71% Temporary agency worker 65% 85% 70% 68% 66% 50 Employed fixed-term 50% 59% 47% 16% 34% Employed open-ended 11% 0 Czech Republic France Netherlands1 Norway Sweden1 Switzerland % working before AW % working after AW Other Student Unemployed Inactive Post situation of Aworkers Previous situation of Aworkers 65% 45% Note: 2010 data if not otherwise stated 1. 2009 data Source: Ciett national reports 2009, 2010
Stepping stone effect also applies in South Africa 2 Reducing structural & frictional unemployment South Africa 2009 Findings Other Temporary agency worker • If you are employed as an agency workers, you are more likely to have an open ended contract than still be an agency worker on year later. • Situation before Agency work was 15% employment • One year after beginning as agency worker 61% are in employment Unemployed Employed fixed-term Student Employed open-ended Inactive % 100 80 60 40 61% working 15% working 20 0 Previous Situation of Aworkers Post situation of Aworkers Source: APSO
Stepping stone effect largely recognised 3 Driving down segmentation Is AW effective to find a permanent job? Is AW effective to find a first job? % of respondents agreeing with the statement, 2010 % of respondents agreeing with the statement, 2010 100% 100% 92% 90% 86% 85% 84% 82% 80% 78% 77% 80% 80% 71% 69% 61% 59% 60% 60% 52% 43% 40% 40% 40% 20% 20% 0% 0% UK BE PL FR ES NL IT DE UK NL PL BE FR ES DE IT High perceived value of AW both to get into the labour market and find a full-time job Note: AW – agency work Source: Regards croisés sur l’intérim, l’Observatoire des Métiers et de l’Emploi, July 2010
Reduction in illegal economy correlates with increase in AWIncrease in illegal economy, decrease in AW in 2009 dues to the crisis 5 Providing decent work Changes in the level of illegal activity ... ... correspond with changes of AW levels European average1 % Illegal economy % AW 18 3 % Illegal economy2 % AW3 2 Germany 19 2.0 16 1 14 0 18 16 5 1.5 17 UK 14 4 12 3 16 1.0 2 10 18 15 2 18 16 1.5 Ireland 14 0.5 1999/00 2003 2005 2007 2009 14 1.0 12 0.5 Illegal economy AW penetration 1: Average of 16 countries, for full list see appendix 2. Measured as % of total GDP 3. AW penetration Note: Two year averages for 1997/98, 1999/00, and 01/02 Source: Prof. Dr. Friedrich Schneider, Department of Economics, Johannes Kepler University of Linz, 2010
Agency work contributes to the fight against undeclared workCountries with high agency work have lower levels of illegal economic activity 5 Providing decent work TAW penetration (% of workforce) 5 R2 = 0.41 United Kingdom 4 3 Netherlands France Japan Belgium 2 Germany Austria U.S.A. Ireland Switzerland Sweden Finland Norway 1 Italy Portugal Spain Denmark Greece 0 5 10 15 20 25 Illegal economy (% of GDP)1 1. Calculated using the currency demand approach and the MIMIC method; for more information see "The Influence of the economic crisis on the underground economy in Germany and the other OECD-countries in 2010: a (further) increase" by Dr. Friedrich Schneider Note: 2008 figures used in order to remove impact of crisis Source: Prof. Dr. Friedrich Schneider, Department of Economics, Johannes Kepler University of Linz, 2010
A sector committed to social dialogue 5 Providing decent work Notes 1) in the UK, cross-sectoral level refers to a single agreement between CBI and TUC rather than to collective bargaining as such. 2) Collective agreements are not allowed for agency workers (20.123 law, art. 304 & 305). 3) There are no CLAs in these countries 1) in Japan, AW sector refers to a single agreement between Rengo and JASSA rather than to collective bargaining as such. Source: Eurofound & Ciett
Key dimensions of PrES Regulatory Efficiency IndexAssesses degrees of flexibility to operate and security for workers 6 Need for appropriate regulation • A – Right of establishment • Legal recognition of the triangular work relationship in all countries • No limitation of services to be delivered (real private employment agencies) • No unjustified and disproportionate barriers to enter the market • B – Right to provide services/ to contract • Ability to offer the full range of labour contracts (no limitations or restrictions) • Removal of key restrictions on the use of AW1 A B C D • C – Right to negotiate/social protection • AW recognized as a sector on its own • Ability to implement social protection for agency workers that can be capitalized and portable • D – Right to contribute to labour policies • Access to training for agency workers to be as broad and easy as possible • Existence of public-private partner-ships in terms of employment services • PrES are committed and involved in the fight against illegal practices and unethical agencies 1. Sectoral bans, caps on number of agency workers, reasons of use, maximum length of assignment, obligations to consult trade unions, renewals Source: Ciett, BCG analysis
Results of regulatory efficiency indexSignificant differences between countries 6 Need for appropriate regulation Right to: Contribute to labour market policies PrES Regulatory Index score Negotiate and social protection 100 Provide services and to contract 93 89 Establishment 86 85 83 80 79 80 76 76 76 76 30 75 74 73 19 27 24 20 69 67 66 14 23 15 24 19 63 16 Ø 65 21 24 59 22 14 58 57 57 60 56 10 19 54 20 21 15 15 9 20 9 18 18 10 49 18 15 13 13 15 46 13 45 17 13 20 17 18 8 41 11 15 10 6 4 3 7 20 38 40 17 3 18 18 18 6 14 14 3 20 13 13 17 17 17 11 18 14 15 3 8 12 18 10 10 15 15 8 13 16 12 8 8 12 8 11 6 11 4 20 14 30 30 30 30 30 30 30 27 27 27 27 27 27 27 27 2 25 23 23 23 23 23 23 22 20 20 20 20 3 18 17 8 0 United Kingdom United States Czech Republic Netherlands New Zealand Luxembourg South Africa Switzerland Denmark Sweden Argentina Germany Lithuania Australia Slovenia Hungary Belgium Norway Estonia Greece Mexico France Austria Poland Turkey Ireland Japan Spain Chile Italy Note: Further clarification outstanding for Eastern European countries Source: National federations, BCG analysis
4 main types of environment where PrES operateImportant sub-groups based on nuances of social systems 6 Need for appropriate regulation Market type Countries Cluster characteristics • Rapid AW development, with appreciable drop-off in the crisis • Open regulatory environment with limited restrictions • Liberal economies favoring flexibility over security • UK, Ireland Market driven Europe 1 Non-Europe • US, Australia, New Zealand 2 Social dialogue based Western Europe • Netherlands • Switzerland, Austria, Germany • Significant degree of AW penetration in relatively mature markets • Moderately regulated, varying balances of flexibility and security • Labor market organized and regulated by collective agreements between social partners Nordics • Sweden, Norway, Denmark, Finland • Historically low AW penetration and slow industry development • Unique Nordic social and economic system Asia • Japan • Generally liberal economies but high value on security and social acceptance challenges 3 • France, Belgium, Luxembourg Legislator driven • Penetration depending on level of industry development, ranging from below to above average • Highly regulated, weighted towards job security over flexibility • Historically labor markets with high unemployment relative to Social dialogue peers Western Europe • Italy, Greece, Spain, Portugal, South Africa Medi-terranean 4 Emerging markets Eastern Europe • Eastern Europe • Nascent industries with AW legally recognised only recently • Regulatory policies still in development • Economic policies and market dynamics still evolving • Latin America Lat Am • India, China Asia
Labor markets performance is related to country clusters 6 Need for appropriate regulation Labor Market Efficiency Index1 1.5 1.3 Market driven Social dialogue based Mean 1.0 Legislator driven 0.9 0.8 0.8 0.7 Emerging markets 0.7 0.5 0.5 0.5 0.5 0.4 0.3 0.2 0.1 0.1 0.0 -0.1 -0.1 -0.2 -0.2 -0.4 -0.4 -0.5 -0.6 -0.6 -0.8 -0.9 -0.9 -0.9 -0.9 -1.0 -1.0 Czech Republic New Zealand Luxembourg Netherlands Switzerland Germany Denmark Australia Slovenia Slovakia Hungary Portugal Belgium Sweden Canada Norway Finland Greece Mexico Austria France Japan Spain Chile USA Italy UK Poland 1. See appendix for methodology discussion Source: OECD, Eurostat
Right level of regulation allows AW to contribute to labour market Clear correlation between AW penetration and Regulatory Efficiency Index score AW penetration rate 20101 (%) 4 UK R2 = 0.42 Netherlands Germany 2 France Belgium USA Switzerland Japan Austria Legislator driven Sweden Social dialogue - CE 1 Social dialogue - Nordics Italy Spain Norway Czech Republic Denmark Social dialogue - Asia Hungary Poland Chile Emerging markets Slovenia Argentina Market driven Greece 0 40 50 60 70 80 90 100 PrES Regulatory Efficiency Index High correlation also within clusters representing different stages of maturity 1. Only 2009 data available for Norway, Hungary, Slovenia, Greece, Austria, Czech Republic, Chile, Denmark Note: No penetration rates available for NZ, MX, TR, AU, EE and LT; Not included in correlation due to exceptional situation or data issues: ZA, IE and LU Source: National federations, BCG analysis
Thanks! Questions? More info at: www.ciett.org James.gribben@ciett.org