Download
1 / 3
30 likes | 113 Vues
Explanation of e vs A Chart. The chart is empirical and assumes that the aircraft drag polar can be expressed as C D = C D min + K(C L – C L min ) 2

E N D
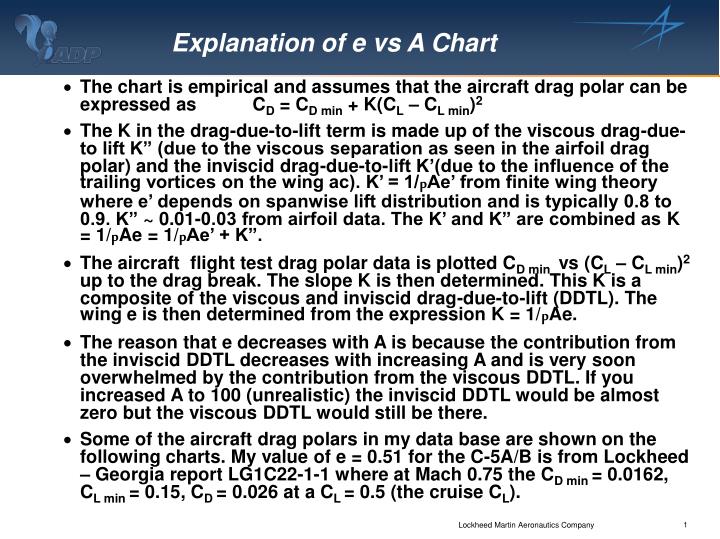
Explanation of e vs A Chart • The chart is empirical and assumes that the aircraft drag polar can be expressed as CD = CD min + K(CL – CL min)2 • The K in the drag-due-to-lift term is made up of the viscous drag-due-to lift K” (due to the viscous separation as seen in the airfoil drag polar) and the inviscid drag-due-to-lift K’(due to the influence of the trailing vortices on the wing ac). K’ = 1/pAe’ from finite wing theory where e’ depends on spanwise lift distribution and is typically 0.8 to 0.9. K” ~ 0.01-0.03 from airfoil data. The K’ and K” are combined as K = 1/pAe = 1/pAe’ + K”. • The aircraft flight test drag polar data is plotted CD min vs (CL – CL min)2 up to the drag break. The slope K is then determined. This K is a composite of the viscous and inviscid drag-due-to-lift (DDTL). The wing e is then determined from the expression K = 1/pAe. • The reason that e decreases with A is because the contribution from the inviscid DDTL decreases with increasing A and is very soon overwhelmed by the contribution from the viscous DDTL. If you increased A to 100 (unrealistic) the inviscid DDTL would be almost zero but the viscous DDTL would still be there. • Some of the aircraft drag polars in my data base are shown on the following charts. My value of e = 0.51 for the C-5A/B is from Lockheed – Georgia report LG1C22-1-1 where at Mach 0.75 the CD min = 0.0162, CL min = 0.15, CD = 0.026 at a CL = 0.5 (the cruise CL).
Subsonic ‘e’ vs Aspect Ratio ‘e’ determined from drag polar CD = CDmin + K ( CL – CLmin)2 K = 1 / pAe SymbolMin CL ~ 0 ~ 0.1 ~ 0.2 ~ 0.3 Closed No Sweep Open Swept Wing 1.0 0.9 F-16C I-26 I-R3 0.8 U-2S F-15E F-104 RQ-4A ASW-12 Genesis 2 F-4C 0.7 Wing Efficiency Factor, e Cirrus Tier 3- Med-High Camber F-20 ASW-27B ASW 22 0.6 A-340 L-1011 LS-8A SB-13 B-52 B-707 F-5E Horten IV W570A B-747 C-5B 0.5 Mach 0.7 - 0.8 Sweep > 25 o Low-Med Camber ASW-20 Sweep ~ 15 o 0.4 0 5 10 15 20 25 30 35 40 Aspect Ratio
High-speed Drag Polars for Large Transport Aircraft – Flight Test Data