Download
1 / 24
240 likes | 307 Vues
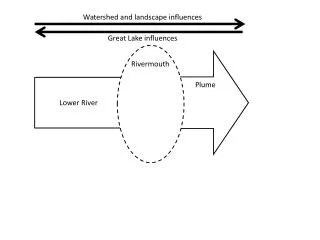
Current ENSO Status, Probabilistic Forecast for the Lower Missouri River Valley, a nd much, much more…. WFO Pleasant Hill Winter Weather Seminar 08 November 2010. Ni ño Indices: Recent Evolution.

E N D
Current ENSO Status, Probabilistic Forecast for the Lower Missouri River Valley, and much, much more… WFO Pleasant Hill Winter Weather Seminar 08 November 2010
Niño Indices: Recent Evolution The latest weekly SST anomalies are right around -1.4oC (all the way from the Nino 4 region to the Nino 1+2 region)
Sub-Surface Temperature Departures (oC) in the Equatorial Pacific • Since the late spring, negative surface and sub-surface temperature anomalies have been present across the equatorial Pacific • The most recent period (below) shows persistent strong negative anomalies (a very large reservoir greater than 4oC below average) in the central and eastern Pacific near the 100m depth.
Upper Oceanic Heat Content Evolutionin the Equatorial Pacific • Last winter and early spring, several oceanic Kelvin waves created strong downwelling and maintenance of El Nino conditions • Since May 2010, these Kelvin wave episode ceased and allowed for upwelling of cooler subsurface water • Recently, the downwelling (warming) phase of a weak Kelvin wave was evident in the central Pacific • Oceanic Kelvin waves have alternating warm and cold phases. The warmphase is indicated by dashed lines. Down-welling and warming occur in the leading portion of a Kelvin wave, and up-welling and cooling occur in the trailing portion.
Low-level (850-hPa) Zonal (east-west) Wind Anomalies (m s-1) Stronger than average easterly trade winds since May Most recent 850 mb Zonal wind anomalies
SST Outlook: NCEP CFS Forecast Issued 17 October 2010 The CFS ensemble mean (heavy blue line) predicts La Nina will last through at least the Northern Hemisphere spring 2010-11.
Multi-Variate ENSO Index (MEI) • MEI is calculated using 6 measured variables over the tropical Pacific: sea level pressure (P), surface u-wind component (U), surface v-wind component (V), sea surface temperature (S), surface air temperature (A), and fractional sky cover (C) • These variables are normalized seasonally to a 1950-93 reference period, with MEI calculated by the co-variance matrix of the combined fields as the first order unrotated principle component. MEI is calculated on 12 bi-monthly seasons, with negative values representing the cold ENSO phase, and positive values the warm phase
Multi-Variate ENSO Index (MEI) Standardized MEI value of -2.0 is one of the lowest ever recorded
Composite La Nina DJF Height and Temperature fields • Height and Temperature anomalies calculated for all moderate to strong La Nina winter seasons as compared to a 1968-1996 climatology • As is typical during La Nina episodes, more intense north Pacific jet energy, with more frequent northwestern CONUS troughing and southeastern CONUS ridging
Composite La Nina DJF Height and Temperature fields • Height and Temperature anomalies calculated for only the best matching La Nina winter seasons (1998-99, 1988-89, 1973-74, 1970-71) • Composites for the best matching La Nina winter are consistent with those for all moderate to strong La Nina winters. Possibly more tendency for blocked flow at high latitudes
Typical Weather Patterns During La Nina Winters
La Nina Temperature and Precipitation (OND) Anomalies and Frequencies • Anomalies are calculated for all La Nina years, with frequencies determined by the number of years which the certain anomaly occurred • Late Autumn and early winter La Nina years are characterized by warmer and drier than average conditions from the southern plains through western Great Lakes. Frequency counts indicate fairly good historical probabilities of this outcome.
La Nina Temperature and Precipitation (DJF) Anomalies and Frequencies • Remember, these anomalies and frequencies are calculated for all La Nina years. There are some differences between weaker events and stronger events. • By mid-winter during La Nina years, both anomalies and frequencies in temperature and precipitation become split over the United States, with little predictable influence over the central Plains and Lower Missouri River valley.
U. S. Seasonal OutlooksDecember 2010 – February 2011 Temperature Precipitation Outlooks combine long-term trends and soil-moisture effects, with typical ENSO cycle impacts, when appropriate.
Local 3 Month Temperature Outlook Dec 2010-Feb 2011 Local Kansas City Temperatures Outlook based on historical comparison of local temperatures with Climate Division temperature probabilities. Initialized from CPC DJF temperature outlook.
Winter Temperature and Precipitation La Nina Analogs
Winter Snowfall Accumulation And Frequency La Nina Analogs
Southern Oscillation Index (SOI) as a Proxy for Historical ENSO State • SOI Index of +25 highest measured since November 1973 and highest September value since 1917 • SOI Index is a normalized value of the monthly SLP difference between Tahiti and Darwin versus the long term mean. • Positive values = enhanced trade winds and La Nina state • Negative values = weaker trade winds and El Nino state
Historical Southern Oscillation Index (SOI) Analog Years for Moderate to Strong La Nina Episodes • SOI Index persistence greater than ±8.0 indicative of sustained enhanced or weaker trade winds, and well developed ENSO phase • Although SOI Index does not always fall in line with ENSO state based entirely on SST anomalies, the larger SOI values generally do correspond with accepted ENSO state • Can be used as a proxy for La Nina analog years prior to 1949
Winter Temperature, Precipitation, and Snowfall La Nina Analogs Prior to 1949
Summary • The atmospheric circulation and precipitation patterns, as well as SST anomalies indicate moderate to strong La Nina conditions already present across the entire tropical Pacific Ocean • SST anomalies are around-1.4oC in the 4 Niño regions, indicative of the beginning of a strong La Nina episode • Based on recent trends and a majority of the statistical and dynamic coupled model forecasts, La Nina conditions should maintain their intensity during the next several months and will likely continue into at least the spring months of 2011 – possibly challenging some of the stronger La Nina episodes on record.
Summary • Based on past 10 year temperature trends and composites of past moderate to strong La Nina winter seasons, there exists a slightly better than normal chance that winter temperatures in eastern Kansas and Missouri will be above average • Choosing a best analog set of the top 4 matching winter seasons based on SST anomalies and MEI time series, the highest probabilities point towards warmer than average temperatures early in the winter season, with less predictability and larger variability later in the winter • There is no reliable predictability concerning precipitation or snowfall based on La Nina composites or analogs with a wide range of historical outcomes
And now for SomethingCompletely Different… • MJO Phase must be in a progressive state lasting 25 or more days • Raw Anomalies are unmasked for all events meeting criteria. Statistical significance determined by Monte Carlo test vs. random anomaly generation
Seasonal MJO Composites • Darker color shades indicate strong statistical significance with little chance the anomaly is due to random chance. • Use as a check against model solutions when strong significance and active MJO phase are present