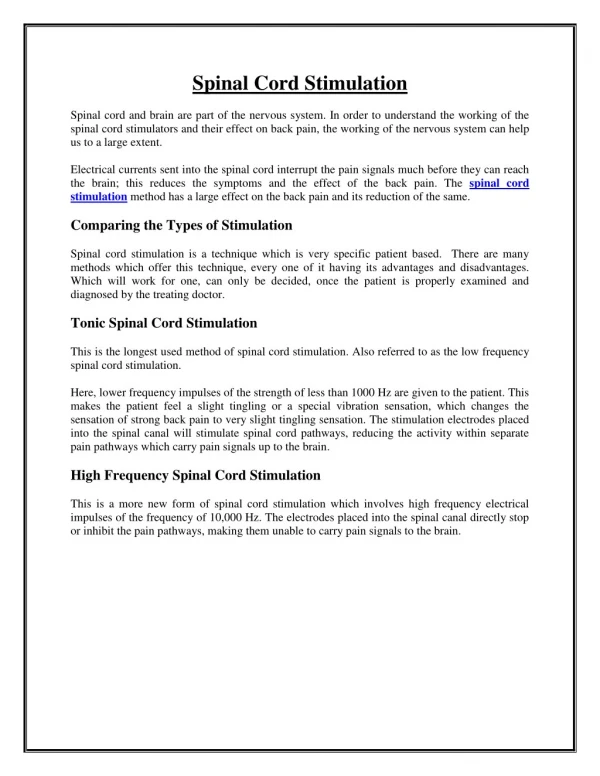
Download
1 / 31
310 likes | 465 Vues
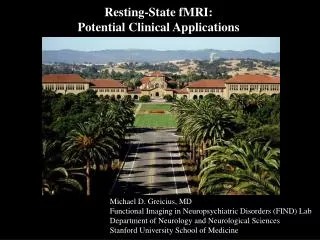
Resting state fMRI changes during Spinal Cord Stimulation. Chima O.Oluigbo, MD, Amir Abduljalil, PhD, Xiangyu Yang, PhD, Andrew Kalnin, MD, Michael V. Knopp, MD, PhD, Ali R. Rezai, MD

E N D
Resting state fMRI changes during Spinal Cord Stimulation Chima O.Oluigbo, MD, Amir Abduljalil, PhD, Xiangyu Yang, PhD, Andrew Kalnin, MD, Michael V. Knopp, MD, PhD, Ali R. Rezai, MD Center for Neuromodulation, Departments of Neurosurgery and Radiology, Wexner Medical Center at The Ohio State University Hospital
Disclosure • No personal disclosures • Funding by Medtronic
Background – Chronic Pain • 70 million Americans, $150 billion per annum, • Develop innovative therapies • New methods to evaluate and characterize pain • Cerebral “signature” for pain perception and modulation • Neural network changes – depression, addiction Farmer et al. Neuroscience Letters 520 (2012): 197-203
Resting State fMRI Allows interrogation of myriad functional systems without the constraints of a priori hypothesis Imaging the brain during rest reveals large-amplitude spontaneous low-frequency (<0.1 Hz) fluctuations Temporally correlated across functionally related areas “Functional connectome” Default mode network Lateral parietal cortex (LPC) Posterior cingulate/ Precuneus (PCC) DEFAULT MODE NETWORK Medial prefrontal cortex (MPC)
Clinical model – Neuropathic extremity pain and spinal cord stimulation
Design Overview OSU IRB approved research study 7 patients Thoracic epidural SCS in place for treatment of CRPS or neuropathic leg pain following FBSS involving one or both lower extremities
Pre-Imaging Clinical evaluation Determine stimulation parameters associated with: 1. SCS Perception threshold 2. “Optimal” pain reduction 3. Uncomfortable stimulation threshold
Pain Quantification Pain quantification was based on the Visual-Analog Scale (VAS) and the measure of percentage change in pain (∆P%) was determined as follows: ∆P% = 100x (POFF – PON)/POFF where PON is the VAS pain rating as reported by the subject during stimulation while POFF is the pain rating reported with the stimulator switched OFF.
MRI safety Under OSU IRB approved research study, modeling analysis and laboratory measurements were performed Determined that the Neuromodulation devices would perform safely under the restrictions of this particular research protocol, MRI equipment, and implant restrictions. Note: cannot be extrapolated to other studies or other systems
fMRI protocol 7 subjects 1 control – 5 sessions of resting fMRI on different days Resting state fMRI 3 T Achieva Philips scanner, transmit /receive head coil. Functional EPI images acquisition: isotropic spatial resolution of 3 mm,TR/TE 2000/30 ms, 80° flip angle, 80×80 matrix size, 35 slices. B0 field map and a high resolution 3D T1 weighted image also acquired: TR/TE 7.9/3.7 ms, 1×1×1 mm3 voxel resolution. Image analysis using FSL (FMRIB Software) and AFNI (NIMH/NIH) tools. Functional images were motion corrected, smoothed (5 mm3) and band-pass filtered (0.005<f<0.1 Hz). 10 minutes scans Simulation Off Low Optimum High
Image preprocessing • Frequency-domain analysis • Seed-based functional connectivity • Independent component analysis (ICA) Computing ALFF (Amplitude of Low Frequency Fluctuation) 1 OFF Similarity coefficient η2 Spatial normalization 1 Optimum Group region based analysis • Frequency-domain analysis • Seed-based functional connectivity • Independent component analysis (ICA)
Results 1: Pain change calculations ∆P% = 100x (POFF – PON)/POFF
Frequency Domain Analysis – Amplitude of Low Frequency Fluctuation(ALFF) ALFF represents the average amplitude in the low-frequency band (0.01–0.08 Hz). Reflects the intensity of regional spontaneous brain activity Calculated by averaging the square root of the power spectrum of a given low-frequency BOLD time course across the frequencies filtered The fALFF shows the ratio of power spectrum of low-frequency (0.01-0.08 Hz) to that of the entire frequency range. It is inverse to ALFF
ALFF Chronic pain – Stimulator OFF (Group summation, n = 7) Normal control (n = 5) -4.5 4.5
fALFF Chronic pain – Stimulator OFF (Group summation) Normal control -4.5 4.5
Similarity coefficient with stimulation at different parameters. 0 = no similarity, 1 = identical Group ALFF OFF Similarity coefficient threshold : Task based 0.5 Resting state 0.35 Low Opt High
Global Similarity coefficient 0 = no similarity, 1 = identical Threshold ≤ 0.35
Seed based correlation analysis Involves the a priori selection of a voxel, cluster or atlas region and then calculate whole-brain, voxel-wise functional connectivity maps of co-variance with the seed region.
Pain related seeds R DLPFC (right dorsolateral prefrontal cortex) 44 36 20 L DLPFC (left dorsolateral prefrontal cortex) -34 31 34 FMC (Frontal medial cortex = Medial orbitofrontal) 0 42 -18 LFI (Left orbital frontoinsula = Left anterior insula) -32 24 -10 RFI (Right orbital frontoinsula = Right anterior insula) 38 26 -10 LAccu (Left nucleus accumbens) -10 12 -8 RAccu (Right nucleus accumbens) 10 10 -8 LAmyg (Left amygdala) -20 -6 -20 RAmyg (Right amygdala) 28 -6 -20 LPIN (Left posterior insula) -39 -24 16 RPIN (Right posterior insula) 38 14 6 RACCX (Right Anterior Cingulate Cortex) = RCC 6 38 14 LACCX (Left Anterior Cingulate Cortex) -2 36 6 Task positive seeds IPS (Interparietal sulcus) -38 -46 54 FEF (Frontal eye field) 26 -12 50 MT (Middle temporal) -46 -68 -2 Default Mode Network Seeds MPF (Medial prefrontal cortex) -2 46 -16 PCC (Posterior cingulated / precuneus) -4 -50 40 LP (Lateral parietal cortex) -46 -68 36
Structural Equation Modeling (SEM) Causality modeling approach Provide measure of effective connectivity Model driven (ie ROI dependent) Provide confirmation for hypothesis testing SEM does not prove causation
Group Off * * * * *
Conclusions • SCS influences supraspinal (cerebral) pain neuromodulation – indirect / direct • Pain control during spinal cord stimulation is associated with change in connectivity between anterior insula (and amygdala) and components of the default mode network (DMN) • ALFF in the region of the DMN is lower in patients with chronic pain compared to control. • Spatially correlated fluctuations in resting state fMRI signals may be a neuroimaging surrogate for higher order pain perception and its modulation in chronic pain states