Download

1 / 51
510 likes | 642 Vues
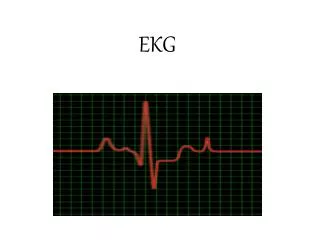
EKG lab. EKG readings. There must be a full 12 leads recorded and labelled plus a rhythm strip, usually from lead II. The baseline must be stable and not wandering. Leads must be well attached, even if it means shaving a hairy chest.

E N D
EKG readings • There must be a full 12 leads recorded and labelled plus a rhythm strip, usually from lead II. • The baseline must be stable and not wandering. • Leads must be well attached, even if it means shaving a hairy chest. • There should be little interference from skeletal muscle. The patient must be relaxed and comfortable.
History of the EKG • 1843 - Emil Du bois-ReymondGerman physiologist Emil Du bois-Reymond describes an "action potential" accompanying each muscular contraction. He detected the small voltage potential present in resting muscle and noted that this diminished with contraction of the muscle. To accomplish this he had developed one of the most sensitive galvanometers of his time. His device had a wire coil with over 24,000 turns - 5 km of wire. Du Bios Reymond devised a notation for his galvanometer which he called the 'disturbance curve'. "o" was the stable equilibrium point of the astatic galvanometer needle and p, q, r and s (and also k and h) were other points in its deflection. Du Bois-Reymond, E. Untersuchungen uber thierische Elektricitat. Reimer, Berlin: 1848. • 1850 - Bizarre unregulated actions of the ventricles (later called ventricular fibrillation) is described by Hoffa during experiments with strong electrical currents across the hearts of dogs and cats. He demonstrated that a single electrical pulse can induce fibrillation. Hoffa M, Ludwig C. 1850. Einige neue versuche uber herzbewegung. Zeitschrift Rationelle Medizin, 9: 107-144 • 1856 - Rudolph von Koelliker and Heinrich Muller confirm that an electrical current accompanies each heart beat by applying a galvanometer to the base and apex of an exposed ventricle. They also applied a nerve-muscle preparation, similar to Matteucci's, to the ventricle and observed that a twitch of the muscle occured just prior to ventricular systole and also a much smaller twitch after systole. These twitches would later be recognised as caused by the electrical currents of the QRS and T waves. von Koelliker A, Muller H. Nachweis der negativen Schwankung des Muskelstroms am naturlich sich kontrahierenden Herzen. Verhandlungen der Physikalisch-Medizinischen Gesellschaft in Wurzberg. 1856;6:528-33. • 1872 - Guillaume Benjamin Amand Duchenne de Boulogne, pioneering neurophysiologist, describes the resuscitation of a drowned girl with electricity in the third edition of his textbook on the medical uses of electricity. This episode has sometimes been described as the first 'artificial pacemaker' but he used an electrical current to induce electrophrenic rather than myocardial stimulation. Duchenne GB. De l'electrisation localisee et de son application a la pathologie et la therapeutique par courants induits at par courants galvaniques interrompus et continus. [Localised electricity and its application to pathology and therapy by means of induced and galvanic currents, interrupted and continuous] 3ed. Paris. JB Bailliere et fils; 1878 - British physiologists John Burden Sanderson and Frederick Page record the heart's electrical current with a capillary electrometer and shows it consists of two phases (later called QRS and T). Burdon Sanderson J. Experimental results relating to the rhythmical and excitatory motions of the ventricle of the frog. Proc R Soc Lond 1878;27:410-414 1887 - British physiologist Augustus D. Waller of St Mary's Medical School, London publishes the first human electrocardiogram. It is recorded with a capilliary electrometer from Thomas Goswell, a technician in the laboratory. Waller AD. A demonstration on man of electromotive changes accompanying the heart's beat. J Physiol (London) 1887;8:229-234 1893 - Willem Einthoven introduces the term 'electrocardiogram' at a meeting of the Dutch Medical Association. (Later he claims that Waller was first to use the term). Einthoven W: Nieuwe methoden voor clinisch onderzoek [New methods for clinical investigation]. Ned T Geneesk 29 II: 263-286, 1893 1895 - Einthoven, using an improved electrometer and a correction formula developed independently of Burch, distinguishes five deflections which he names P, Q, R, S and T. Einthoven W. Ueber die Form des menschlichen Electrocardiogramms. Arch f d Ges Physiol 1895;60:101-123 1931 - first patented pacemakerDr Albert Hyman patents the first 'artificial cardiac pacemaker' which stimulates the heart by using a transthoracic needle. His aim was to produce a device that was small enough to fit in a doctor's bag and stimulate the right atrial area of the heart with a suitably insulated needle. His experiments were on animals. His original machine was powered by a crankshaft (it was later prototyped by a German company but was never successful). "By March 1, 1932 the artificial pacemaker had been used about 43 times, with a successful outcome in 14 cases." It was not until 1942 that a report of its successful short term use in Stokes-Adams attacks was presented. Hyman AS. Resuscitation of the stopped heart by intracardial therapy. Arch Intern Med. 1932;50:283
EKG Set-up • attach three limb leads – I, II and III (also the basis for the leads aVR, aVL, aVF) • the 3 limb leads form an imaginary inverted triangle over the heart = Einthoven’s triangle • There should be a square wave calibration to show that 1mV is equivalent to 1cm in height. • Speed should be 25mm/sec. Hence 1 large square is 200msec and 1 small square is 40msec.
LEFT ARM RIGHT ARM -3 LIMB LEADS (I,II,III) -3 AUGMENTED LEADS (aVR, aVL, aVF) -6 CHEST LEADS (V1 – V6) EINTHOVEN’s TRIANGLE LEFT LEG
The Leads • lead = tracing of the voltage difference between two electrodes • e.g. lead I = voltage between the right arm electrode and left arm electrode • e.g. lead II = voltage between the right arm electrode and left arm electrode • at rest – heart muscle has a –ve charge • becomes +ve as it depolarizes • the EKG measures the depolarization “wave” as the voltage increases or decreases between two electrodes placed on either side of the heary • for the EKG – electrodes are paired • output from each pair = lead • leads are either unipolar or bipolar • bipolar = have two poles – one is positive, the other is negative • leads I, II & III • unipolar = have two poles – one is positive, the second is the WCT (-ve) • aVR, aVF, aVL, V1 – V6
WCT -ve
- Wilson’s Central Terminal (WCT) = used as the –ve electrode -average of the three limb leads -average potential over the entire body
Leads cont… • limb leads = I, II and III • lead I = voltage difference between LA and RA (I = LA-RA) • spread from right side of heart to left • lead II = voltage difference between LL and RA (II = LL-RA) • spread from right side of heart toward apex • lead III = voltage difference between LL and LA (III = LL-LA) • spread from left side of heart to apex
augmented leads = aVR, aVL, aVF • also called Goldberg’s leads • derived from the 3 limb leads • these leads use the WCT as the –ve electrode • they are positive electrodes that examine the heart from different angles • signal is too small to be useful when the WCT is used as the –ve electrode – so the signal must be amplified • avR = +ve electrode is on the right arm, -ve electrode is LA + LL – this augments the signal strength of the RA electrode • aVR = (I + II)/2 • aVL = +ve electrode is on the left arm, -ve electrode is RA + LL – this augments the signal strength of the LA electrode • aVL = 1-II/2 • avF = +ve electrode is on the left leg, -ve electrode is LA + RA – this augments the signal strength of the LL electrode • aVF = II-I/2
Precordial leads • V1 to V6 = chest leads • because of close proximity to the heart – do not require augmentation • use the WCT as the –ve electrode • unipolar leads
The layout • 4 columns of 3 rows result • each segment is only 1 to 3 heart beats • bottom of the EKG frequently has the rhythm strip – from lead limb II
LIMB LEAD I: Right arm -> left arm LIMB LEAD aVR: right arm CHEST LEADS V1-V6 LIMB LEAD II: Right arm -> left leg LIMB LEAD aVL: left arm LIMB LEAD aVF: left leg (foot) LIMB LEAD III: Left arm -> left leg Rhythm strip
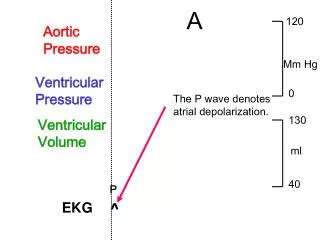
The waves & intervals • P wave (80msec) = atrial depolarization • SA to AV node and right atrium to left • absence: atrial fibrillation and SA blocks • increased amplitude = hypokalemia (low K+) • PR interval (120-200msec) = SA node through the AV node and into ventricles • AV node function and coordination between atrial and ventricular conduction systems • long interval – 1st degree AV block • PR segment (50-120msec) = end of P wave to the start of the QRS complex • impulse vector is from AV node to the bundles to the purkinje fibers • electrical activity through these structures does not result in contraction directly • PR interval is more clinically relevant http://en.wikipedia.org/wiki/File:ECG_principle_slow.gif
The waves & intervals • QRS complex (80-120msec) = rapid depolarization of ventricles • large muscle mass = larger amplitude vs. P wave • problems in Purkinje fibers – widened QRS • used to diagnose: cardiac arrhythmias, conduction abnormalities, ventricular hypertrophy and myocardial infarctions • J point = point at which the QRS finishes and the ST segment begins • used to measure ST elevation or depression • J wave – can appear as a small wave after the QRS • pathogenic – hypothermia and hypocalcemia (low Ca) • ST segment (80-120msec) = end of QRS to the start of the T wave -period when ventricles are depolarized • ST interval (320msec) = from J point to the end of T wave
The waves & intervals • QT interval (up to 420msec) = start of QRS to the end of the T wave -examines the internal conduction of the entire ventricle - prolonged interval is a risk factor for ventricular tachyarrhythmias and sudden death • T wave (160msec) = recovery of ventricles -from beginning of QRS to apex of T wave is called the absolute refractory period -last half of T wave = relative refractory or vulnerable period -narrow T wave = hyperkalemia (high K+)
Vectors • each lead “views” the heart from different angles and shows which region of the heart is affected • leads II, III and aVF look at electrical activity from the inferior surface of the heart • leads I, aVL, V5 & V6 – from the lateral wall of the left ventricle • leads V1 & V2 – from the septal wall • leads V3 & V4 – from the anterior surface of the heart • overall direction of the depolarization wave is called the axis • Axis = general direction of the heart’s depolarization wavefront • related to where the bulk of the heart’s muscle is – generally the left ventricle • oriented from the right shoulder to the left leg • if the left ventricle increases it activity or its size = left axis deviation • if the right ventricle increases its size = right axis deviation
EKG Tracings • overall spread of depolarization is from right shoulder to left leg • A positive wave form (above the baseline) results from the wave of depolarization moving towards the positive electrode/end of a lead. • A negative waveform (below the baseline) is when a wave of depolarization is moving away from the positive electrode (towards the negative end of the lead). • so for limb lead I – spread of depolarization wave is from RA (-ve) to the LA (+ve) – positive wave results (same for II and III) • for aVR – wave is towards the WCT (-ve) – negative wave results • for aVL and aVF – spread is generally from –ve to +ve overall spread of depolarization wave
Normal EKG • Vertical axis is potential (voltage) • EKG paper has 1 millimeter small squares - so height or depth of wave is measured in millimeters.10 mm = 1.0 mV • Horizontal axis is time. • 40 msec for 1 mm (1 small box). • 200 msec seconds for 1 large box = 5 small boxes = 5 x .04 seconds.
Normal EKG R wave = 7-8 mm high in Lead I = 7-8 mV.QRS wave = 0.06 seconds long in Lead I. 1mm = 10mV 1mm = 40msec QRS T 7.0mV P 0.06sec 0.5mV 0.2sec
EKG interpretation: look at five areas, in order, on each EKG. • Rate • Rhythm (Intervals) • Axis • Hypertrophy • Infarct
QUESTIONS TO ASK and ANSWER • Rhythm and Rate • Are there P waves? • Are they regular? • Does every one precede a QRS? • Is the PR interval constant? • What is the PR interval? • The PR interval should be between 120 and 240 msec (3 to 6 small squares)
Calculating Rate (ventricular rate) -if the QRS lands on a heavy line – count the next as 300
Mathematical method: official way of determining rateUse this method if there is a regular bradycardia, i.e. - rate < 50. • Count number of large boxes between first and second R waves=7.5. 300/7.5 large boxes = rate 40. • Six-second method:Count off 30 large boxes = 6 seconds (remember 1 large box = 0.2 seconds, so 30 large boxes = 6 seconds). Then, count the number of R-R intervals in six seconds and multiply by 10. This is the number of beats per minute. This is most useful if you have an irregular rhythm (like atrial fibrillation) when you want to know an average rate. • Count 30 large boxes, starting from the first R wave. There are 8 R-R intervals within 30 boxes. Multiply 8 x 10 = Rate 80.
Rhythm • A reasonable way to group arrhythmias is in four general groups. • 1. Irregular rhythms • 2. Escape & premature beats • 3. Ectopic beats • 4. AV blocks
Rhythm QRS is narrow (normal). If the beat is ventricular in origin, the QRS is wide and bizarre because it doesn't come down the normal pathway. QRS is wide – problem with the Purkinje fibers??
Group 1: Irregular rhythms • A) Sinus arrhythmia. • rate = 45-100 b/min • if the rate varies a lot over the strip, this term is used. • P waves and PR intervals are all identical because they originate from the sinus node. • Sinus rate may vary normally a bit (increase with inspiration, decrease with expiration) • inspiration – stretch receptors in lung stimulate cardiac centers in the medulla • QRS is normal • Sinus arrhythmia: P waves are not identical in spacing along the strip.
B) Wandering atrial pacemaker - also called multifocal atrial tachycardia. • - pacemaker shifts from SA node to somewhere in the atria &/or the AV node • seen best in lead II – as flattened or notched P waves • if the atrial pacemaker location varies it will take different lengths of time to get to the ventricle - resulting in different PR intervals. • increase vagus nerve activity can also cause this – slows the SA node and allows the AV node to take over pacemaker function Flattened P wave or P wave is “notched”
C) Atrial fibrillation. • You will frequently see this arrhythmia. • there are no P waves, only irregular or wavy baseline. • the QRS complexes are irregularly spaced, therefore it is included under irregular rhythms.
Group 2: Escape & Premature beats • escape beat is late • premature beat is early • Atrial escape • Different appearing and late P wave. • Ventricular escape • No P, wide, bizarre QRS.-An ectopic pacemaker fires early before the next scheduled beat. • Premature atrial contraction • "PAC", early and differently shaped P wave, narrow QRS. ventricular escape
Premature ventricular contraction (PVCs) • heartbeat initiated by the Purkinje fibers – skipped beat or palpitations • ventricles contract before the atria – cannot be filled optimally • - No P, wide bizarre QRS • - PVCs that occur three (3) or more in a row is called ventricular tachycardia (ectopic focus) • multifocal PVCs (different shapes) • numerous causes: drugs (prozac, cocaine), dehydration, hypercalcemia, hypokalemia, stress, heart murmurs, hypoxia, ischemia • treatments – b-blockers (block the binding of epinephrine & other stress hormones), Ca channel blockers, K+ or Mg+ supplementation PVC PVC PVC
Group 3: Ectopic Focus • excitable group of cells outside of the SA node depolarizes • rate of firing exceeds that of the SA node • if chronic – can lead to tachycardia and fibrillations • [100-250] Tachycardia • [250-350] Flutter • [350+] Fibrillation
Ventricular tachycardia (Vtac): note fast rate and wide bizarre QRS -rapid rhythm originates within the ventricular tissue -absence of P waves -wide bizarre QRS only
Paroxysmal supraventricular tachycardia: note accelerated rate and narrow QRS complexes -paroxysmal – lasts only a few seconds to a minute – then normal rate and rhythm are re- established -supraventricular – rapid rhythm originates above the ventricular tissue -sources – SA node, AV node or from the atrial tissue -PSVT – loop of electrical current involving the AV node -treatment – Valsalva maneuver – hold your nose and blow (increase vagal tone) -treatment – cold water on face -treatment – cardiac massage
Atrial flutter: “sawtooth” pattern prior to QRS complexes. Ventricular fibrillation: erratic and wavy baseline.
(occur in three (3) degrees, like skin burns; third degree is the worst). • 1st degree = AV nodal disease • -PR interval > 0.2 seconds (1 large box) • - each P is followed by a QRS. • - seen also in athletes with increased vagal tone (activity) • can be caused by acute MI, beta-blockers • generally won’t progress • benign condition • but can increase the risk of atrial fibrillation (irregular heartbeat) • The PR interval is approximately 0.28 seconds. Group 4: AV blocks
dropped QRS increased time between P and QRS start - increasing PR interval before the QRS is dropped, then the cycle is repeated. 2nd degree block or Mobitz -one or more – but not all – of the atrial impulses fail to conduct to the ventricles -two types – type I/Wenckebach and type II -in both types – a P wave is blocked from initiating a QRS complex - type 1 -Also called "Wenckebach". -PR interval gets progressively longer each beat until finally a QRS is "dropped" (missing). -a pattern can be discerned -disease of the AV node
2nd degree block - type 2 -Also called "Mobitz II". -Look out! A more serious conduction problem than Type 1. -PR intervals are constant and a QRS is "dropped" intermittently. -no pattern can be discerned -disease of the Bundles of His and Purkinje fibers Note the dropped QRS after the second and sixth P wave in lead II (the rhythm strip). Dropped QRS P wave P wave Dropped QRS Normal PR interval
P P P P • 3rd degree block • The atrial rate is independent of the ventricular rate (P wave and QRS march out separately. • The clue here is no relationship at all of the P-R intervals. • The P-R interval is constantly changing, the QRS is usually wide and bizarre because it is ventricular origin. • Note the P waves and QRS waves are independent of each other. blockage of transmission from SA through the AV node
QRS interval (beginning of Q to the end of the S wave) should be < .12 seconds (< 3 small boxes). • If QRS is > 0.12sec, check for bundle branch block. • Figure 25: RBBB. Bundle Branch Blocks 0.04sec x 20 = 0.8sec • Bundle Branch Block • Right bundle branch block occurs as a congenital anomaly or is associated with volume overload in the right ventricle. • Left bundle branch block is almost always pathological, reflecting disease of the left ventricle. • Right bundle branch block produces a prolonged QRS, usually about 160 msecs or 4 small squares • Left bundle branch block produces a longer QRS, usually around 200 msec with a more square pattern than RBBB. The changes are best seen in the lateral V leads.
If QRS is > 0.12 and RR occurs in the left chest leads (V5-V6), this indicates a left bundle branch block. Figure 26: LBBB.
EKG lab: in class lab 300 150 100 75 The rate is about 90. The second R wave in the rhythm strip lands on a heavy line. Count "300-150-100-75" over (four heavy lines) to the next R wave to determine the rate. You'll have to estimate between 75 and 100 for this example.
The rate is about 40. Use the bradycardia method where 300 divided by the number of large boxes between R waves is the rate. In this case, there are 7.5 large boxes between R waves. 300 divided by 7.5 equals a rate of 40.
Estimate the rhythm of this strip Is the pattern normal? What condition is this??
Atrial Irregularity Is the pattern normal? What atrial condition is this?? Look at the P waves – are they normal? What atrial condition is this??
FOR EACH OF THE FOLLOWING STRIPS – diagnose the condition and justify your diagnoses Ventricular Irregularity This condition lasts only a few seconds what is it?
FOR EACH OF THE FOLLOWING STRIPS – diagnose the condition and justify your diagnoses
200 msec Measure the PR interval (remember each small block is 40msec) -what type of block is this?
THESE STRIPS ARE BLOCKS – what type are they?? e.g. 1st, 2nd or 3rd?? QRS P P QRS P P P QRS P Hint – look at the P/QRS pattern QRS QRS P P P Hint – measure the PR intervals