Download
1 / 15
150 likes | 243 Vues
AGEC 420. Today Trading Wheat position, new statement, adjustments ?? New position ?? Open Interest Basis and storage. Open Position - MidAm Wheat. Fri., Feb 15: Bot 1 MidAm May Wheat @ 2.82; Sell stop @ 2.74½ Close $ +/- Fri., Feb 15 2.81 ¾ -$2.50

E N D
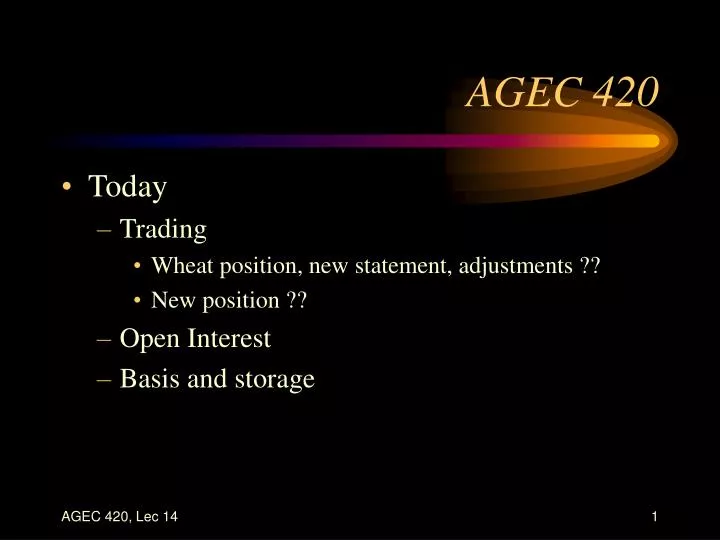
AGEC 420 • Today • Trading • Wheat position, new statement, adjustments ?? • New position ?? • Open Interest • Basis and storage
Open Position - MidAm Wheat • Fri., Feb 15: Bot 1 MidAm May Wheat @ 2.82; Sell stop @ 2.74½ Close$ +/- Fri., Feb 15 2.81 ¾ -$2.50 Tue., Feb 19 2.83 ¾ +$17.50 Wed., Feb 20 2.85 ½ +$35.00 Thu., Feb 21 2.84 +$20.00 Fri., Feb 22 ??? Possible Actions Adjust sell stop; Set profit objective – OTO ??
Volume & Open Interest • Volume • Number of contracts traded (i.e., bought or sold) in a specified period (usually a day) • Open Interest (OI) • Total number of contracts that have not been offset • Each open position has a buyer and seller – but just count one side for OI (see example, HW 2)
What do Volume & Open Interest Indicate? • Volume Up and Open Interest Down • traders are exiting the market • if price is up ==> a “short covering rally” • Volume Up and Open Interest Up • traders entering the market • if price is down ==> bearish signal • if price is up ==> bullish
Tracking Historical Basis • Usually tracked weekly • Grains – typically use midweek price • Wed. cash bid – Wed. closing futures price • Livestock – typically use weekly average
Grain Basis • Nearby basis: Cash – Nearby futures • Example: Cash bid today in Topeka – March futures • Roll over to the May futures after 1st week of March • Deferred basis: Cash – deferred futures
Cash Price vs. Basis For Wheat • The Standard Deviation of Price is 4 to 5 times the Standard Deviation of Basis ==> Easier To Forecast Basis
Basis: Seasonal Patterns Typically for Kansas: Basis weakest after harvest Most of the basis increase occurs by late fall Basis declines moderately through the winter
Factors Influencing Basis • Basis reflects “local” supply and demand conditions relative to the overall market • If local supplies are very large, expect a more negative basis
Forecasting Basis • Grains, 5 year average for the relevant time period • livestock, use 3 year average • Identify and use seasonal patterns • Examine high and low basis level to identify basis risk