Download
1 / 20
200 likes | 296 Vues
IPUMS-International partners by stage final stage (data in development/dissemination) = darkest middle stage (signed agreement) = medium green first stage (verbal agreement, signing pending) = lightest. Composite coding scheme: employment status. integrated codes. Codes in original data.

E N D
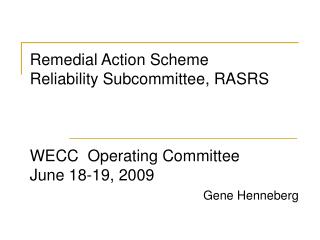
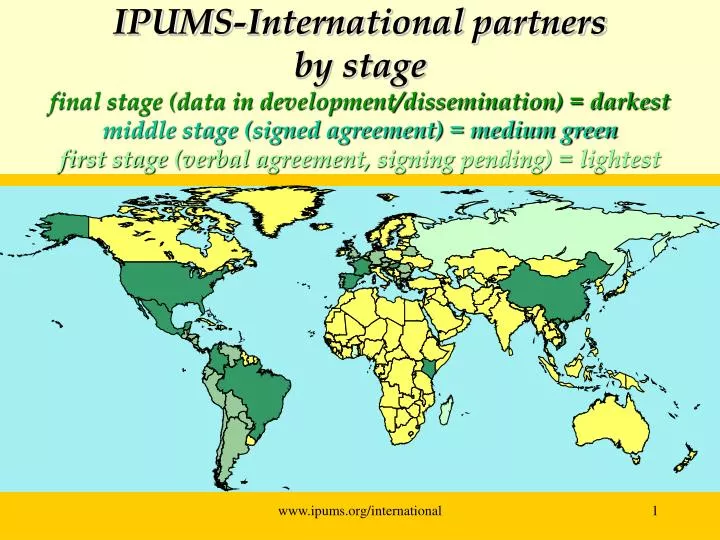
IPUMS-International partners by stagefinal stage (data in development/dissemination) = darkestmiddle stage (signed agreement) = medium greenfirst stage (verbal agreement, signing pending) = lightest www.ipums.org/international
Composite coding scheme: employment status integrated codes Codes in original data www.ipums.org/international
Calibrating census microdata against a gold standard (employment survey): women in the workforce, Mexico 1990 and 2000* * *Robert McCaa, Albert Esteve, Rodolfo Gutierrez and Gabriela Vasquez, Minnesota Population Center paper at: www.hist.umn.edu/~rmccaa/mxflfp.doc Calibrate, v. 1864. a. trans....to graduate a gauge of any kind with allowance for its irregularities.The Oxford English Dictionary Online(Oxford: Clarendon Press, 2001) www.ipums.org/international
Today’s Presentation • The paper: Calibrating census microdata a. Census vs. employment surveysb. Female labor force participationc. vs. ENEU (“national” urban survey): 1990 & 2000d. vs. ENE (national survey): 2000e. Conclusion: Mexican census microdata on FLFP are better than commonly thought www.ipums.org/international
Calibration testMexico 1990, 2000: FLFP census microdata vs. employment surveys Employment surveys: date from the late 1980s; many probing questions finely tuned instrument administered by trained interviewers Urban (ENEU)—quarterly from 1987, 16 cities in 1990, rising to 47 in 2000--lacks national coverage; National (ENE)—from 1988; annual since 1995 Census microdata: strength: national coverage back to 1960 weakness: untrained interviewers, one question on LFP omits many working women, particularly informal workers Purpose of paper: calibrate census microdata w/ employment surveys www.ipums.org/international
IPUMS-InternationalEmployment Status variablecomparability discussion:Mexico 1990, 2000 “In 1990, the employment status question refers to ‘Principal Activity’ and therefore under-reports secondary economic activity by students, housewives, family-workers, the semi-retired, and others. “The 2000 Census sought to overcome deficiencies in reporting work status for people whose primary activity was not work (students, housewives, retirees, etc.), but who in fact were working according to international definitions. A second question, introduced for the first time in 2000, sought to capture this secondary economic activity. For strict comparability with earlier Mexican censuses, this recovered activity (codes 1101-1106) should be considered ‘inactive’." www.ipums.org/international
2000 census--two questions on LFP: 1: “Last week did (NAME)...” ...” 2000 census--two questions on LFP: 1: “Last week, did (NAME)...?” 2: “Besides (...), did (NAME)...?” Question 1: Last week (Name): Did you work? 27.5% Had work? 0.4 Look for work? 0.3 Are you a student? housewife? retired? permanently incapacitated? Did you not work? Question 1: Last week (Name): Did you work? 27.5% Had work? 0.4 Looked? 0.3 Q. 1&2: combined student/wrkd 0.5 housewife/wr 3.7 retired/wrkd 0.0 other/wrkd 0.4 no reply/wrkd 0.0 Question 2: Did you help in a family business? Sell some product? Make some product to sell? Help on a farm or with livestock? Or in exchange for pay did you do some other activity? www.ipums.org/international
Table 1. Selected microdata samples of Mexico, 1960 - 2000 Year Type Sample Size % pop. 1960* Census 502,702 1.5 1970* Census 480,265 1.0 1980 Census No sample available due to earthquake damage 1990* Census 802,774 1.0 1990, ENEU (urban survey) 172,233 0.2 2000* Census 10,099,182 10.0 2000 ENEU (urban survey) 562,471 0.62001 ENE (national survey) 588,912 0.6 (*integrated in IPUMS-International) Coming soon!!!New 10% samples for 1970, 1990 & 2000 www.ipums.org/international
The problem (table 2) Mexico’s “global” female labor force participation rate (12-64 years) microdata19902000 survey (ENEU): 34.8% 43.3% national census: 20.6% 32.9% 14.2 10.4 A solutionControl for survey (ENEU) sampling frame: 16 cities in 1990 survey (16 cities): 34.8% 41.7% census (16 cities): 29.0% 40.2%* 5.8 1.5 * includes responses to LFP questions 1 (“activity”) & 2 (“verification”). www.ipums.org/international
Table 3. Urban Females, 1990(aged 12-64) StructureFLFP Rates SurveyCensusSrvyCnss Total 62,248 63,929 34.8 29.0 Education Less than 6 years 20.9 21.7 29.3 20.1 Completed primary 34.7 34.8 27.6 21.1 Completed middle 20.4 24.3 31.3 37.9 Post-middle (10+) 23.9 19.3 53.1 42.2 Marital Status Married (all types) 48.2 50.4 27.7 21.3 Not in union 51.8 49.6 41.4 36.9 www.ipums.org/international
Table 5. Females 2000: Urban (limited to same 16 cities as 1990) StructureFLFP Rates SurveyCensusSrvyCnss Total 124,051 1,073,222 41.7 40.2 Education Less than 6 years 14.9 15.9 35.3 31.0 Completed primary 30.8 28.7 32.1 30.1 Completed middle 28.5 19.7 47.0 41.0 Post-middle (10+) 25.8 36.0 51.1 51.9 Marital Status Married (all forms) 51.9 52.9 35.1 34.0 Not in union 48.1 47.1 48.9 47.3 www.ipums.org/international
Table 5. Logistic Regression: Source (Females 1990, 2000; same 16 cities as in ENEU 1990) Female labor force participationENEU (indicator) vs. CensusVariable B S.E. Wald df Sig R Exp(B) 1990: -.2212 .0135 267.2291 1 .0000 -.0412 .8015 2000: .0860 .0067 163.1781 1 .0000 .0100 1.0898 Model source effect taking into account age, marital status and education. Interpretation If for both sources weights are considered correct and slight structural differences are taken into account: 1990 census under-reported 20% of FLFP. 2000 census “over-reports” FLFP by 9%. www.ipums.org/international
Today’s Presentation • 1. The project: IPUMS-International a. Preserving the world’s census microdatab. And making them usable • 2. The paper: Calibrating census microdata a. Census vs. employment surveysb. Female labor force participationc. vs. ENEU (“national” urban survey): 1990 & 2000d. vs. ENE (national survey): 2000e. Conclusion www.ipums.org/international
Table 6a. Females 2000: National StructureFLFP Rates SurveyCensusSrvyCnss Total 212,890 3,431,891 39.8 32.9 Education Less than 6 years 22.0 27.6 30.9 23.3 Completed primary 38.0 30.0 36.4 25.0 Completed middle 16.5 16.8 41.2 36.8 Post-middle (10+) 23.5 25.6 52.4 49.9 Marital Status Married (all forms) 54.7 54.8 36.3 27.6 Not in union 45.3 45.2 43.9 39.3 www.ipums.org/international
Table 6b. Females 2000: National Limited to municipios in ENE StructureFLFP Rates SurveyCensusSrvyCnss Total 39.8 35.7 Education Less than 6 years 22.0 22.3 30.9 25.4 Completed primary 38.0 29.6 36.4 26.7 Completed middle 16.5 30.8 41.2 40.5 Post-middle (10+) 23.5 27.3 52.4 55.5 Marital Status Married (all forms) 54.7 54.3 36.3 30.1 Not in union 45.3 45.7 43.9 42.2 www.ipums.org/international
Postscript* * * * * * * www.ipums.org/international
Fig 1. LFP by sex and marital statusMexico 1990 and 2000 (national figures) Females 1990 Males 2000 www.ipums.org/international
Marriage and education strongly affect FLFP (Mexico 1990 and 2000, national figures) Not Married 1990 2000 www.ipums.org/international
Reflections Mexican census microdata may be more informative, than commonly thought—even about FLFP Mexican census microdata on FLFP display remarkable coherence in time and space “Chorus of calamity” on Mexican FLFP may overlook enormous changes in education weakening power of patriarchy over married women real advances of women in the workforce 2000 microdata tell the story Calibrate me! weigh strengths and weaknesses of sources. www.ipums.org/international
Thank you* * * * * * *rmccaa@umn.edu www.ipums.org/international