Download
1 / 30
300 likes | 360 Vues
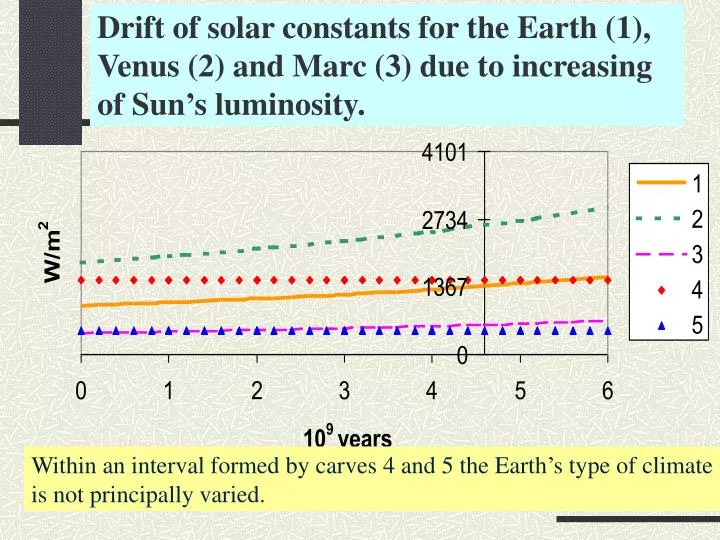
Drift of solar constants for the Earth (1), Venus (2) and Marc (3) due to increasing of Sun’s luminosity. Within an interval formed by carves 4 and 5 the Earth’s type of climate is not principally varied. Variation of СО 2 concentration in the atmosphere.

E N D
Drift of solar constants for the Earth (1), Venus (2) and Marc (3) due to increasing of Sun’s luminosity. Within an interval formed by carves 4 and 5 the Earth’s type of climate is not principally varied.
Temperature deviation from today’s value 1 – calculation [Budyko et al., 1985]2 – interpretation of proxy indicators [Frakes, 1979]
Measured concentration of 18 O in surface planktonies[Imbrie et al., 1984] 1 5e 5d 6 2 1, 2, 5e, 5d, 6 are some isotopic stages
Changes of temperature in north western part of Russian Plane (0C) [Klimanov, 1996.] July January Year AT YD Al YD – Younger Dryas, Al – Allered, AT – Atlantic warm event
Northern summer temperature changes (0С) [Bradley, Jones, 1993] Temperature changes (0С), based onmeasurements in holes Changes of Alpian glacier’s length [Oerlemans, 1994] Glaciers: 1 – Untere Grindelwaldgletscher, 2 – Rhonegletscher, 3 – Glacier d’Argentiere
Climate dynamics and insolation change during last 140 тыс. лет Insolation at the top of the atmosphere 103 years BP 18O summer winter eccentricity obliquity precession Parameters of the Earth’s orbit
Latitude-month distribution of the difference in insolation (W/m2) between 21 and 6 ka and the present 21 ka BP 6 ka BP
Equation of the general circulation model (GCM) dX/dt=F, X=X(0)
Global surface air temperature 21 ka BP-control from different GCMs Simulations forced by CLIMAP SSTs Simulations with atmosphere-mixed layer ocean model
Mean annual temperature anomalies (LGM minus modern) averaged by PMIP models Sites where LGM temperatures have been reconstructed
Comparison between reconstructed and simulated mean annual temperatures anomalies (LGM minus modern) over the land for all available sites
Comparison between reconstructed and simulated mean annual temperatures anomalies (LGM minus modern) over the land for the sites from the areas with simple topography and environments 1 – Western Europe and North Africa 2 - East European Plane 3 – North-East North America 4 – West Siberian Plane 5 – Eastern Siberia and Chukotka 6 – Greenland 7 – Antarctica 8 – Mongolia and North China 9 – Brazil 10 – South Africa 11 – Australia
Comparison between reconstructed and simulated mean annual temperatures anomalies (LGM minus modern) over the land averaged by the regions pointed in the legend 1 – Western Europe (9) and North Africa (1) 2 - East European Plane (5) 3 – North-East North America (4) 4 – West Siberian Plane (10) 5 – Eastern Siberia and Chukotka (6) 6 – Greenland (1) 7 – Antarctica (1) 8 – Mongolia (2) and North China (2) 9 – Brazil (1) 10 – South Africa (2) 11 – Australia (1)
Mean annual precipitation anomalies (LGM minus modern) averaged by PMIP models
Latitude-month distribution of the difference in insolation (W/m2) between 21 and 6 ka and the present 21 ka BP 6 ka BP
PMIP-model averaged temperature anomalies (0С) and anomalies of precipitation (mm/day) 6 ka BP (june, july, august)
Relationship between precipitation changes over northern India and changes of surface air temperature over central Asia models
Temperature (0C) and precipitation (mm/day) anomalies for July, 6-0 ka BP Simulated and recorded temperature anomalies over land MSU model
Changes in zonal annual mean precipitation averaged over Northern Africa (6 – 0 ka BP, PMIP results) Max and min bounds for the excess precipitation to support grassland
Changes in zonal annual mean precipitation averaged over Northern Africa (6 – 0 ka BP, PMIP results) and impact of ocean feedback Coupled atmosphere-ocean simulation
Changes of temperature in north western part of Russian Plane (0C) [Klimanov, 1996.] July January Year AT YD Al YD – Younger Dryas, Al – Allered, AT – Atlantic warm event
Scheme of glaciation of the North America during the Younger Dryase and routes of meltwater discharge
Time series of the deviation of salinity, sea surface temperature (0C) and ice (sm) from their initial values in the Denmark Strait (1250-year time integration of GFDL model) Response of the thermochaline circulation of the North Atlantic to fresh water input to its northern part (1) and Caribean region (2) Fresh water input to the northern North Atlantic
Measured concentration of 18 O in surface planktonies[Imbrie et al., 1984] 1 5e 5d 6 2 1, 2, 5e, 5d, 6 are some isotopic stages
Milankovitch cycles Red noice White noice Red noice
Red noice Red noice
Oscillator for global climate change dT/dt=T(t)+v =1 + 2 + 3 … denotes the delta-function Scaling time and T is the nondimensional delay, measures the influence of the returning signal
Linear stability analysis T0-T0-T03=0 T0=0, (1-)1/2 y=T-T0 The neutral curve: Perturbation from the stationary solution 0.5 2 unstable modes 0 5 10