Download
1 / 11
110 likes | 257 Vues
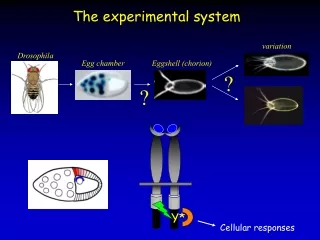
Drosophila Solexa data analysis. Ahsan 3/25. :TSS (Transcription Start Site). :TIS (Translation Initiation Site). :500bp. : Exon. Gene location in genome Case 1(A). 取り扱う領域: 翻訳開始点 (TIS) から 点線の先頭 までのゲノム領域にあるタグをその遺伝子の 発現量として計算する。 問題: 以上のような配置の遺伝子ではなにも問題はない。.

E N D
Drosophila Solexa data analysis Ahsan 3/25
:TSS (Transcription Start Site) :TIS (Translation Initiation Site) :500bp : Exon Gene location in genomeCase 1(A) 取り扱う領域:翻訳開始点(TIS)から点線の先頭までのゲノム領域にあるタグをその遺伝子の 発現量として計算する。 問題: 以上のような配置の遺伝子ではなにも問題はない。
:TSS (Transcription Start Site) :TIS (Translation Initiation Site) :500bp : Exon Gene location in genomeCase 1(B) • 取り扱う領域:翻訳開始点(TIS)から点線の先頭までのゲノム領域にあるタグをその遺伝子の • 発現量として計算する。 • 問題: • 上の遺伝子のExon/Intron領域内にあるtagは下の遺伝子のタグとして数えてしまう。
:TSS (Transcription Start Site) :TIS (Translation Initiation Site) :500bp : Exon Gene location in genomeCase 2 • 取り扱う領域:翻訳開始点(TIS)から点線の先頭までのゲノム領域にあるタグをその遺伝子の • 発現量として計算する。 • 問題: • 上の遺伝子のExon/Intron領域内にあるtagは下の遺伝子のタグとして数えてしまう。 • 下の遺伝子のタグを取り扱うゲノム領域が上の遺伝子の翻訳開始点(TIS) 以下になる。
:TSS (Transcription Start Site) :TIS (Translation Initiation Site) :500bp : Exon Gene location in genomeCase 3 • 取り扱う領域:翻訳開始点(TIS)から点線の先頭までのゲノム領域にあるタグをその遺伝子の • 発現量として計算する。 • 問題: • 下の遺伝子のタグを取り扱うゲノム領域が上の遺伝子の翻訳開始点(TIS) 以下にすると発現量はゼロになってしまう。 • 現在:上の遺伝子を無視しています。
遺伝子の発現量 • 今の定義にしたがって、遺伝子の発現量を計算する。 • 遺伝子の名前とflybase transcript Id も含まれている。 • 村松さんから依頼あったデータをサーバにおいてあります。 • 遺伝子(Case 1): 7,002 • 遺伝子(Case 2): 9,912 • 遺伝子(Case 3): 4,009
Promoter 領域の解析(1)従来の定義と問題 • Promoter 領域の定義? • 普通、転写開始点を挟んで(-100bp,+100bp)の間の領域をpromoter 領域として定義する(ref1,ref2)。 • Promoter module を調べる? • Promoter 領域のmotif 配列を調べて,張り付く転写因子からpromoter moduleを考える。 今回はTIS(翻訳開始点)から上流のゲノム領域内にあるタグをその遺伝子の発現量として考えている。 よって、各タグの先頭を転写開始点(TSS)としててしまうと解析は難しくなる。 Ref1: Smale ST: Core promoters: active contributors to combinatorial gene expression. Genes Dev 2001, 15:2503-2508 Ref2: Butler JEF, Kadonaga JT: The RNA polymerase II core promoter: a key component in the regulation of gene expression. Genes Dev 2002, 16:2583-2592
:5endTag Promoter 領域の解析(2)クラスタの定義、タグのクラスタを扱う クラスタの定義 下の図のようにタグ先端の位置(TSS:転写開始点)の距離が200塩基以下のもの全部を一つクラスタとして定義する。 発現量の対象になるゲノム領域内にあるタグをクラスタ化した。 細胞内: distance<=200bp タグをアライン後: distance<=200bp
Promoter 領域の解析(3)解析方法 解析その1: • 各クラスタ内の最大の転写量を持っているタグの先端を転写開始点(TSS)として選択する。 • 選択された転写開始点を挟んで(-100bp,+100bp)領域をpromoter領域にする。同じ遺伝子のクラスタ化された転写開始点が2個以上ある場合はpromoter領域が重ならないようにする。(図) • Promoter 領域内に転写因子が張り付くmotif があるかどうかを調べる。 • Motif の有無にしたがって,その遺伝子のpromoter module を調べる。 • 解析その2: • クラスタ化された領域にある転写開始点数、発現量、発現量の分布を調べる。
(-100,100)bp (-100,100)bp 代表的な転写 開始点 (-x,y)bp 代表的な転写 開始点 :5endTag :5endTag Promoter 領域の解析(4)解析方法(クラスタ化された転写開始点が2個以上ある場合) 図:代表転写開始点間の(-100,100)bp領域が重なってしまう (-100,100)bp 図:代表転写開始点間の領域が重ならないように下流のクラスタ領域を調整する
解析結果 • 解析その1: • TATA box, Initiator, downstream promoter elements (DSP)が張り付く領域をしらべた。 • TATA( 5’-TATAAA-3’) • DSP motif(30bp downstream from TSS :G-A/T-C-G ) • Initiator motif (YYAN(T/A)YY ) Y:C/T • 他のelements も見る必要がる。