Download
1 / 25
250 likes | 405 Vues
Southern California Water Dialogue. February 26, 2014. 2013 Hydrologic Conditions. Percent of Average Precipitation (%) Calendar Year 2013. Driest Calendar Year on Record. 2014 Hydrologic Conditions. Percent of Average Precipitation (%) 10/1/2013 – 1/31/2014.

E N D
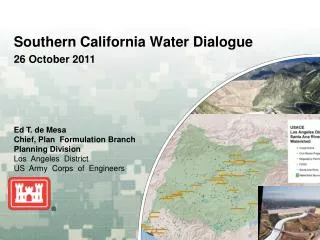
Southern California Water Dialogue February 26, 2014
2013 Hydrologic Conditions Percent of Average Precipitation (%) Calendar Year 2013 Driest Calendar Year on Record
2014 Hydrologic Conditions Percent of Average Precipitation (%) 10/1/2013 – 1/31/2014 Percent of Average Precipitation (%) Oct 2013 – Jan 2014 Driest Oct-Jan on Record 17%
2014 Hydrologic Conditions Percent of Average Precipitation (%) Water Year to Date Still Below Average 41%
Statewide Impacts Lake Ghisolfo, Calistoga January 2014 Almaden Reservoir, San Jose January 2014 Lake Oroville December 2013 Folsom Lake, Sacramento January 2014
State of California Drought Emergency • Governor Brown declaration on January 17 • “Perhaps the worst drought California has seen since records began being kept” • Calls for citizens to do their part and reduce water use by 20 percent • Looks to clear the way for water transfers and exchanges
Recent Events • Second snow survey is only 12% of normal snowpack to date (expected to improve) • DWR reduced the SWP Table A Allocation to zero percent (January 31) • SWRCB granted a joint DWR/USBR petition • Reduces Delta Outflow requirements to minimum • Provides flexibility in Delta Cross Channel operations
Northern Sierra Hydrologic ConditionsEight Station Index WY 1922-2013 Before Storm 17% Min17.1 Avg50.4 Max88.5 4.5 46.2
Northern Sierra Hydrologic ConditionsEight Station Index WY 1922-2013 After Storm 41% Min17.1 Avg50.4 Max88.5 12.9 46.2 4.5
Northern Sierra Hydrologic ConditionsEight Station Index WY 1922-2013 Min17.1 Avg50.4 Max88.5 46.2
Colorado River Hydrologic ConditionsUpper Colorado Basin Snowpack 96% Before Storm 9.7
Colorado River Hydrologic ConditionsUpper Colorado Basin Snowpack 112% After Storm 11.5
Probability of Surplus/Shortage Based on January 2014 Conditions
2014 Available SupplyBased on Currently Allocated Supplies Winter storms may improve the SWP Allocation • SWP: 600 TAF • Table A Allocation: 0 • Storage & Programs: 600 TAF • CRA: 1.2 MAF • Priority 4: 550 TAF • Colorado System Storage & Programs: 650 TAF
2014 Supply and Demand BalanceBased on Currently Allocated Supplies and Demands
2014 Supply and Demand Balance SWP improvement can increase supplies
2014 Supply and Demand Balance Conservation reduces storage depletion
MWD Storage ReservesEnd of Year Balances* *Estimated actual storage balances, may be subject to change.
MWD Storage ReservesEnd of Year Balances* Storage use will vary based on actual conditions *Estimated actual storage balances, may be subject to change.
Diversification of Water Portfolio Early 1990’s 2010 IRP Strategy Heavy dependence on imported supply and SWP Diversions Emphasis on Conservation, Local Supplies, and Storage & Transfers CURRENT AS OF 051711
Regional Investments Reducing Reliance on Imports Conservation: 900,000 af/yr Recycling: 335,000 af/yr Groundwater Recovery:111,000 af/yr Seawater: 46,000 af/yr (planned) Conservation represents regional actions both active & passive Recycling & groundwater represents total regional production 2012 (MWD & member agency) Seawater represents 3 planned local projects
MWD Storage Capacity Additional Lake Mead 13xIncrease in Capacity Lake Mead Demo Mojave Demo & Additional Prop. 13 Mojave Amendment Kern Delta Prop. 13 Programs Diamond Valley Lake Castaic & Perris Arvin Edison Semitropic Desert / Coachella Lake Mathews& Lake Skinner
Summary • Unprecedented conditions • Metropolitan’s IRP has prepared • Metropolitan is prepared to use storage to meet demands • Water use efficiency is key region-wide • Metropolitan is taking drought actions • Water Supply Alert • Conservation and Recycled Water Budget • Coordination with other agencies
Regional Investments Reducing Reliance on Imports Conservation: 900,000 af/yr Recycling:335,000 af/yr Groundwater Recovery: 111,000 af/yr Seawater: 46,000 af/yr (planned) Conservation represents regional actions both active & passive Recycling & groundwater represents total regional production 2012 (Metropolitan & member agency)