Download
1 / 34
340 likes | 464 Vues
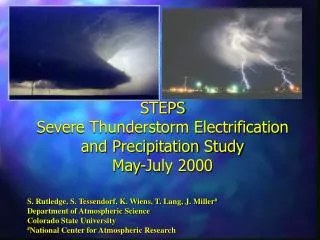
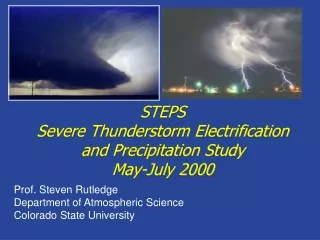
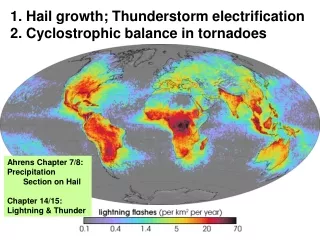
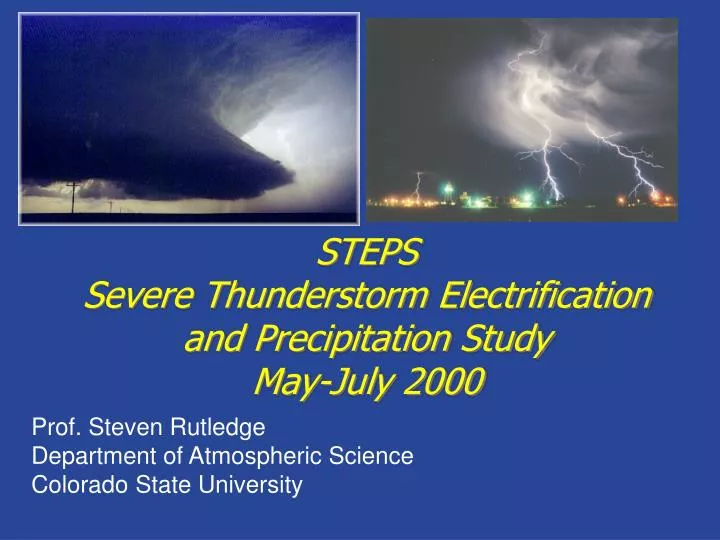
STEPS Severe Thunderstorm Electrification and Precipitation Study May-July 2000. Prof. Steven Rutledge Department of Atmospheric Science Colorado State University. Radar Network. Dual-Doppler and Triple Doppler configurations. STEPS Ops Center.

E N D
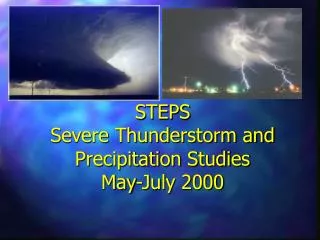
STEPSSevere Thunderstorm Electrification and Precipitation StudyMay-July 2000 Prof. Steven Rutledge Department of Atmospheric Science Colorado State University
Radar Network Dual-Doppler and Triple Doppler configurations
STEPS Ops Center CSU-CHILL National Radar Facility; 10 cm polarimetric/Doppler www.chill.colostate.edu
STEPS Fixed Instrumentation: Triple-Doppler Network and LMA (VHF TOA) • At KGLD: • NWS • T-28 • NSSL • Electric field balloon • Mobile mesonet • MGLASS
2130 UTC 2328 UTC KGLD 0110 UTC 0251 UTC Tessendorf et al., JAS, 2005 Storm swath of base reflectivities (2100-0251 UTC) with NLDN lightning data overlaid.
23 June storm Early: normal tripole, -CGs • 29 June Supercell • Inverted tripole • +CGs • 3 June storm • Inverted dipole • No CGs Later, collapse: inverted tripole, +CGs
Q: Why did charge structures differ? A: Supercooled liquid water content. 29 June + 3 June + 23 June
Switching gears now, lets talk about polarimetric radar……
NWS Polarimetric upgrade!! A really exciting opportunity for the science community as well! The STSR architecture first developed on the CSU-CHILL radar in 1995. Proof of concept. In STSR, H-V polarizations transmitted at the same time. Previously, alternate transmission of H,V used. Needed method to switch polarizations with so called “ferrite” switch—very unreliable.
The polarization variables.. • In addition to Z and Doppler velocity.. • Zdr, differential reflectivity • Sensitive to particle shape and phase • Power based measurement • Φdp, differential phase (Kdp) • Sensitive to particle shape and phase • Phase based measurement • ρhv, correlation coefficient • Sensitive to particle shape and phase • Power based measurement
V hail rain H Zdr = 10 log10 (Zhh/Zvv)
Single particle Zdr expressed as dB Illustrates dependence on both shape and phase, water vs. ice (dielectric) Plot from Herzegh and Jameson (1992)
Non-precipitation echo: insects (preferred flight direction) Zdr values reach CHILL data system limit (+9 dB) Large Z and Zdr when looking at long axis of insects, oriented with mean wind. see Lang et al. 2004 J. Atmos. Ocean. Tech.
Propagation Differential Phase, φdp V • φdpis a phase based measurement, independent of power • Since the H wave encounters more dielectric compared to the V wave, the H wave moves more slowly than the V wave. H wave lags the V wave therefore in phase. • Φdp is then the phase difference (in degrees) between the H and V wave as these waves propagate out and back to the radar. This difference (degrees) will be > 0 for oblate particles (rain), zero for isotropic media (hail), and < 0 for prolate particles (e.g., oriented ice particles). H
From A. Illingworth, Chapter 5, in Weather Radar (2003) P. Meischner, Editor (Springer) Illustration of H and V waves propagating through oblate raindrops. A phase lag between H and V waves results since the H wave moves slightly more slowly than the V wave, in oblate media. For prolate media, the V wave lags the H wave. Phi dp (propagation differential phase) is a measure of this phase difference between H and V waves.
PPI display presentation of differential propagation phase -20o diff. phase at near point +15o ~8 km farther range 35o phase change in 8 km Basic concept: H, V return signal phase difference changes most rapidly in beam path segments where net differential forward scattering effects are large
Conversion to customary Kdp units: (Bringi and Chandra (2001) Eq 7.17) Kdp is only arrived at after “filtering” the range profile of φdp Too little filtering introduces noise in rain estimates, too much filtering removes fine scale estimates of rain rate and rain rate local peaks. From a physical perspective…. Kdp is product of rainwater content and deviation of mass-weighted mean axis ratio from one. (Alternatively, particles with mean axis ratio of one (tumbling hailstones) do not contribute to Kdp). Kdp is phase measurement, not dependent on accurate radar reflectivity calibration (including partial beam blockage effects), Zdr offsets / drifts, etc.
Rain rate estimation… Increasing rain rate
CHILL: Rainfall Accumulation Optimization Algorithm CHILL: Rainfall Accumulation NEXRAD Z-R Algorithm Ice contamination!
Engineering Parking Lot at Colorado State University: Flash Flood of 28 July 1997 CHILL observations of the Ft. Collins flood led to research that caused the NWS in Denver to modify their algorithms used to derive rainfall rates from NWS radar measurements
An Example from the Ft. Collins Flash Flood of 28 July 1997: Cumulative Rainfall Gauge Survey Z = ARb
Vertical structure of microphysical classification Hydrometeor type classification results for 5 July storm from STEPS (data from CSU-CHILL)—Model Intercomparison
Squall line and HID using polarimetric variables
Co-polar H,V Correlation (ρhv) The correlation coefficient is a measure of the shape variations or irregularities in the radar resolution volume…… The correlation coefficient decreases when diverse particles types are present. This diversity can be in phase of water, shape and size.
ρhv reduction to ~0.91 in a hail shaft: 7 June 1995 near Gilcrest, CO CSU-CHILL data Negative Zdr; these values also modeled for larger, wet hail. Mie effects operate to reduce ZH relative to ZV, leading to negative Zdr. For axis ratios in range of 0.6 to 0.8.
rhv reduced in hail area: Mixed precip types; ρhvespecially reduced when Zrain=Zice Diverse shapes
REMOVING NON-MET ECHO: FUZZY LOGIC CLASSIFICATION (FHC) Example from JPOLE of rain embedded in clutter/AP and biological scatterers Clutter/AP Rain Insects/Birds Ryzhkov et al. (2005)
Correlation coefficient summary: Primarily useful to characterize variability of scatterer characteristics within the pulse volume. Drizzle / light rain > ~0.98 Convective (but no ice) rain > ~0.96 Hail / rain mixtures ~0.90 Bright band mixed rain and snow ~0.75 Tornado debris ~0.50 or less Ground clutter ~0.6-0.8
Bright band descending to surface in rain/snow transition
Vertical profile in a snowstorm.
Dual offset antenna: 2008 Prof. Bringi leads a successful >$1M MRI proposal to acquire a new antenna Offset feed design, first time be used on an S-band weather radar Unprecedented performance has now been demonstrated Advances the Facility to a new level of performance The new antenna set the stage for another major development…..
Dual-wavelength project CASA Magnetron T/R Pkg Main Reflector • No other radar like this in the world • Will allow CHILL to make impact on NWS gap-filling radar concept • Takes advantage of CASA second generation radar • Unique dual-frequency combination enables new science • CSU cost share dollars used to acquire critical components • Will be tested later in the spring…. Dual-frequency Feed Horn Feed Horn Sub-Reflector CSU-CHILL Update