Download
1 / 52
520 likes | 653 Vues
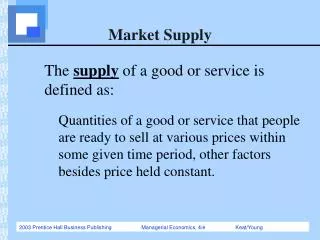
Market Mechanism Supply. Module 3. Understand the difference between supply and quantity supplied. Objectives. Understand the difference between supply and quantity supplied. Define the “Law of Supply” and explain why the supply curve is usually upward sloping. Objectives.

E N D
Market Mechanism Supply Module 3
Understand the difference betweensupply andquantity supplied. Objectives
Understand the difference betweensupplyandquantity supplied. Define the “Law of Supply” and explain why the supply curve is usually upward sloping. Objectives
Understand the difference betweensupplyandquantity supplied. Define the “Law of Supply” and explain why the supply curve is usually upward sloping. Understand the difference between a change in supply and a change in quantity supplied. Objectives
Understand the difference betweensupplyandquantity supplied. Define the “Law of Supply” and explain why the supply curve is usually upward sloping. Understand the difference between a change in supply and a change in quantity supplied. Understand what causes the supply curve to shift. Objectives
Objective 1 • Understand the difference between supply and quantity supplied. 6
Objective 1 • Understand the difference between supply and quantity supplied. • A supply curve shows the quantities supplied by a producer at various prices. 7
Objective 1: … the difference between supply and quantity supplied. • A supply curve shows the quantities supplied by a producer at various prices. Chris’ Supply Schedule Chris’ Supply Curve The supply curve shows the relationship between the price of a product and the quantity supplied of that product. 8
Objective 1: … supply and quantity supplied…. • Quantity suppliedis the quantity of a product that a firm is willing and able to supply at a particular price. • Quantity supplied refers to a point on the supply curve.
Objective 1: … supply and quantity supplied • Quantity suppliedis the quantity of a product that a firm is willing and able to supply at a particular price. • Quantity supplied refers to a point on the supply curve. If the price of coffee is $1, Chris is willing to supply 1 cup (point “g”). If the price of coffee is $3, Chris is willing to supply 5 cups (point “l”). If the price rises to $4.50, Chris is willing to supply 8 cups of coffee (point “t”). Quantity supplied: point on the curve 10
Objective 1: … supply and quantity supplied • Supply versus Quantity Supplied:Supply refers to the entire curve while quantity supplied is associated with a point on the curve. 11
Objective 2 • Define the “Law of Supply” and explain • why the supply curve is upward sloping
Objective 2 • Define the “Law of Supply” and explain • why the supply curve is upward sloping • The Law of Supplystates that holding everything else constant, an increase in the price of a product causes an increase in the quantity supplied and a decrease in the price of a product causes a decrease in the quantity supplied.
Objective 2: … explain why the supply curve is upward sloping • Why is there a positive relationship between price and quantity supplied?
Objective 2: … explain why the supply curve is usually upward sloping Two factors explain the Law of Supply: 1. Profit motive: A higher market price, holding all else constant induces suppliers to increase quantity supplied because profit margins increase.
Objective 2: … explain why the supply curve is usually upward sloping • Two factors explain the Law of Supply: 1. Profit motive: A higher market price, holding all else constant induces suppliers to increase quantity supplied because profit margins increase. 2. The law of Increasing Opportunity Cost: As more and more is produced, resources must be drawn away from alternative uses, bidding up the opportunity cost. Thus, producers require higher prices to supply more of a product. 16
Objective 3 Understand the difference between a change in quantity supplied and a change in supply
Objective 3 Understand the difference between a change in quantity supplied and a change in supply • A change in quantity suppliedrefers to a movement along a supply curve in response to a change in the price of the product.
Objective 3: … a change in quantity supplied and a change in supply. • A change in quantity suppliedrefers to a movement along a supply curve in response to a change in the price of the product. Quantity supplied changes when price changes. This is shown as a movement along a curve. 19
Objective 3: … a change in quantity supplied and a change in supply
Objective 3: … a change in quantity supplied and a change in supply • A change in supply is shown as a shift of the entire supply curve. In other words, at every price, quantity supplied has now changed.
Objective 3: … a change in quantity supplied and a change in supply • A change in supply is shown as a shift of the entire supply curve. In other words, at every price, quantity supplied has now changed. • A change in supply is not caused by a change in price.
Objective 3: … a change in quantity supplied and a change in supply. • A change in supply is shown as a shift of the entire supply curve. In other words, at every price, quantity supplied has now changed. • A change in supply is not caused by a change in price. • A change in supply is caused by a change in factors other than the price of the good in question.
Objective 3: … a change in supply • A decrease in supply is represented by a leftward shift of the supply curve.
Objective 3: … a change in supply • A decrease in supply is represented by a leftward shift of the supply curve. Initially, at a price of $3.00, Chris was willing to supply 5 cups of coffee but now at the same price he is willing to supply 3 cups of coffee (from “l” to “v”).
Objective 3: … a change in supply • An increase in supply is represented by a rightward shift of the supply curve.
Objective 3 … a change in supply • An increase in supply is represented by a rightward shift of the supply curve. Initially, at a price of $1.00, Chris was willing to supply 1 cup of coffee but now at the same price he is willing to supply 3 cups of coffee (from “g” to “r”).
Objective 4 Understand what causes the supply curve to shift • Recall the ceteris paribus requirement: Along a supply curve, only price and quantity supplied change; all other factors that affect the supply decision are held constant. • What are these other factors (other than price) that affect the supply decision?
1. Price of the good Objective 4 Understand what causes the supply curve to shift Determinants of Supply include:
1. Price of the good 2. Prices of inputs such as wages Objective 4 Understand what causes the supply curve to shift Determinants of Supply include:
1. Price of the good 2. Prices of inputs such as wages 3. Technological change Objective 4 Understand what causes the supply curve to shift Determinants of Supply include:
1. Price of the good 2. Prices of inputs such as wages 3. Technological change 4. Prices of substitutes in production (rival goods) Objective 4 Understand what causes the supply curve to shift Determinants of Supply include:
1. Price of the good 2. Prices of inputs such as wages 3. Technological change 4. Prices of substitutes in production (rival goods) 5. Price of complements in production (jointly produced goods) Objective 4 Understand what causes the supply curve to shift Determinants of Supply include:
1. Price of the good 2. Prices of inputs such as wages 3. Technological change 4. Prices of substitutes in production (rival goods) 5. Price of complements in production (jointly produced goods) 6. Number of firms in the market Objective 4 Understand what causes the supply curve to shift Determinants of Supply include:
1. Price of the good 2. Prices of inputs such as wages 3. Technological change 4. Prices of substitutes in production (rival goods) 5. Price of complements in production (jointly produced goods) 6. Number of firms in the market 7. Expectations of suppliers about future prices Objective 4 Understand what causes the supply curve to shift Determinants of Supply include:
1. Price of the good 2. Prices of inputs such as wages 3. Technological change 4. Prices of substitutes in production (rival goods) 5. Price of complements in production (jointly produced goods) 6. Number of firms in the market 7. Expectations of suppliers about future prices 8. Government policies that affect production Objective 4 Understand what causes the supply curve to shift Determinants of Supply include:
Objective 4: … what causes the supply curve to shift • A change in the price of the good causes a movement along the supply curve.
Objective 4: … what causes the supply curve to shift • A change in the price of the good causes a movement along the supply curve. • A change in any determinant other than the price of the good in question causes a shiftof the supply curve. 38
Objective 4: … what causes supply to shift Example 1: Supply shifter – Wages The United Auto Workers (UAW) has successfully negotiated higher wages. What happens in the auto industry?
Objective 4: … what causes supply to shift Example 1: Supply shifter – Wages The United Auto Workers (UAW) has successfully negotiated higher wages. What happens in the auto industry? Do not confuse wages (supply determinant) with income (demand determinant).
Objective 4: … what causes supply to shift Example 1: Supply shifter – Wages The United Auto Workers (UAW) has successfully negotiated higher wages. What happens in the auto industry? Do not confuse wages (supply determinant) with income (demand determinant). An increase in wages increase the cost of production. The supply curve shifts left.
Objective 4: … what causes supply to shift Example 2: Supply shifter – change in producers’ expectations Suppose suppliers of silver expect the price of silver to fall next month. How does this affect the supply of silver today? • Today, supply increases in anticipation of lower prices in the future.
Objective 4: … what causes supply to shift Example 2: Supply shifter – change in producers’ expectations Suppose suppliers of silver expect the price of silver to fall next month. How does this affect the supply of silver today? • Today, supply increases in anticipation of lower prices in the future. The Supply of Silver S0: Today’s demand curve with some given set of expectations about price Today’s price S1: Today’s supply curve with a new set of expectations about price
Objective 4: … what causes supply to shift Example 3: Supply shifter - change in the price of a rival (in production) good Land is used to grow soybean and corn. What happens to the supply of corn following a decrease in the price of soybean? 44
Objective 4: … what causes supply to shift Example 3: Supply shifter - change in the price of a rival (in production) good Land is used to grow soybean and corn. What happens to the supply of corn following a decrease in the price of soybean? • Soybean and corn are substitutes in production or rivalgoods. 45
Objective 4: … what causes supply to shift Example 3: Supply shifter - change in the price of a rival (in production) good Land is used to grow soybean and corn. What happens to the supply of corn following a decrease in the price of soybean? • Soybean and corn are substitutes in production or rivalgoods. • When two goods are rivals in production, they must share at least one common input. In this example, land is the common input and soybean and corn are rivals in production. 46
Objective 4: … what causes supply to shift Example 3: Supply shifter - change in the price of a rival (in production) good A decrease in the price of soybean will decrease the quantity supplied of soybean. This is shown by a movement along the supply curve for soybean. 47
Objective 4: … what causes supply to shift Example 3: Supply shifter - change in the price of a rival (in production) good A decrease in the price of soybean will decrease the quantity supplied of soybean. This is shown by a movement along the supply curve for soybean. Farmers now allocate more land toward producing corn. The supply curve for corn shifts right. • A decreasein the price of soybean leads to an increase in the supply of corn, given that soybean and corn are rivals in production. 48
Objective 4: … what causes supply to shift Definition of Rivals in Production • Two goods S and C are rivals (or substitutes) in production if adecrease in the price of good Sleads to anincrease in the supply of good C or, if an increase in the price of good S leads to an decrease in the supply of good C.
Objective 4: … what causes supply to shift Definition of Rivals in Production • Two goods S and C are rivals (or substitutes) in production if adecrease in the price of good Sleads to anincrease in the supply of good C or if an increase in the price of good S leads to an decrease in the supply of good C. • A negativerelationship exists between the price of good S and the supply of good C.