Download
1 / 24
240 likes | 394 Vues
Remote Visualization of Large Datasets with MIDAS & ParaViewWeb. Web3D – Paris 2011 Julien Jomier , Kitware julien.jomier@kitware.com. Motivation. This tissue ribbon is collected by a submerged conveyor belt. Knife advances. Tissue rotates.

E N D
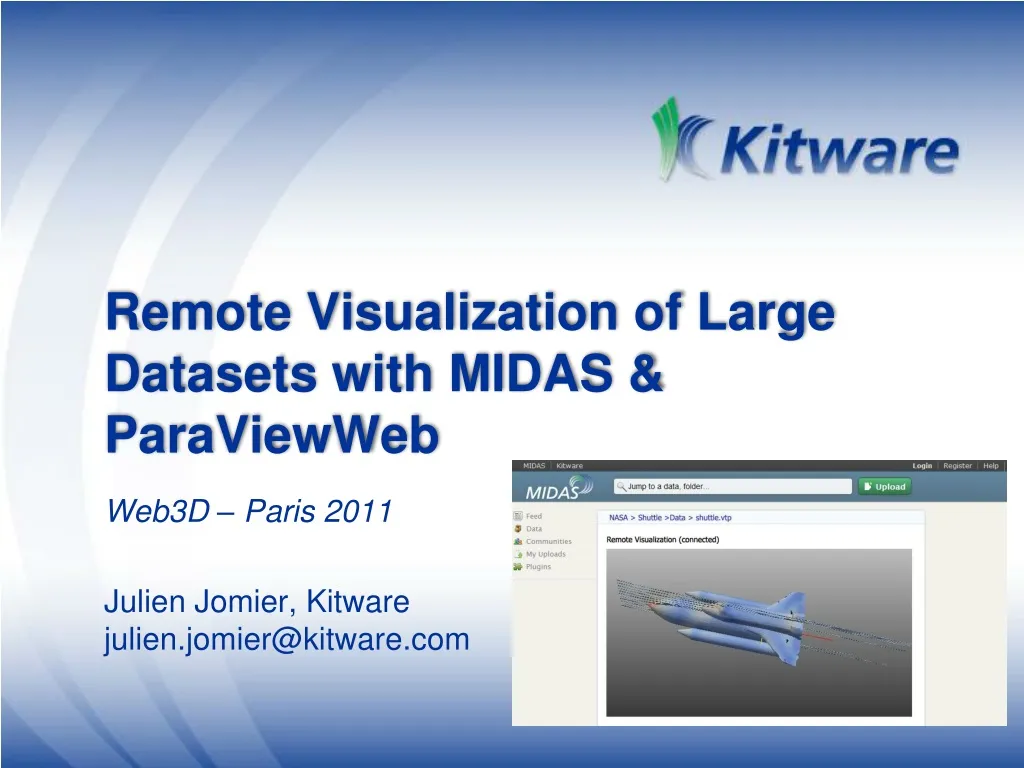
Remote Visualization of Large Datasets with MIDAS & ParaViewWeb Web3D – Paris 2011 JulienJomier, Kitwarejulien.jomier@kitware.com
This tissue ribbon is collected by a submerged conveyor belt Knife advances Tissue rotates These synchronized motions produce a spiral cut through the tissue block, yielding a continuous ribbon of tissue in the knife’s water boat Acquiring Data (2)
0.1 mm 100 mm
Motivation • Datasets are becoming massive • Moving massive datasets is a bottleneck • Effective processing and visualization start with data management • Processing should be performed in place • Complex visualization should be done remotely • Simple visualization should be enabled locally
Outline • Remote visualization with ParaViewWeb • Data management with MIDAS • MIDAS/ParaViewWeb Integration • Applications
Open Source Visualization Tools • Visualization Toolkit (VTK) • C++ (5+M LOC), binding for Python, Java, TCL • Large community: Top 2%, 2500+ users • ParaView • Front-end to VTK • Parallel visualization • Qt-based • Scripting in Python Open-Source (BSD)
ParaViewWeb • It’s ParaView • Web Services • Interactive Viz Applets • JavaScript Visualization API • Adds Collaboration to Data Exploration • Multiple Clients can interact with the same visualization • ParaView.org
ParaViewWeb http://www.webviz.org
10 29
Architecture • JavaScript library + Renderer (JS/Java/Flash) • Web service (JSON-RPC + HTTP) • Processing and Rendering engine • allow multi deployment configuration • (local, remote, distributed)
MIDAS • Web-based Multimedia Digital Archiving System • Store, search and manage digital media • Open Source (BSD) • Modular and highly customizable framework • Server side processing via distributed computing • Online visualization
MIDAS Framework • Database: • PDO • NoSQL • Storage: • local • remote • Amazon S3 • Processing: • local • Hadoop • Batchmake
Integration Challenges • Data repository & Visualization clusters separated • Data (distributed) • Visualization (parallel) • Getting the data to the visualization cluster • Getting the data from the visualization cluster • Data can be heterogeneous • Size vs. Speed • Metadata is important for visualization
Integration Implementation • Driven from a central location (MIDAS) • Getting the data to the Visualization cluster • Standard network storage (NFS, AFS, Samba) • Remote protocol (FTP/Http) • Getting the rendered image to MIDAS • ParaViewWebJavascript API • RESTFulAPI • Streaming/WebGL
Interactive Science Publishing • Optical Society of America • Enhance traditional publishing with 3D rendering • Sponsored by the National Library of Medicine • Low-resolution < 10s • High-resolution = background • Open Datasets • http://midas.osa.org
Conclusion • Data management and visualization system • Hybrid visualization • Server-side processing • Analysis
Acknowledgments • Charles Marion • SebastienJourdain • UtkarshAyachit • DOE SBIR Phase II Award DE-FG02-08ER85143 • NIH STTR Phase II Award 2R42NS059095-03
Remote Visualization of Large Datasets with MIDAS & ParaViewWebQuestions? JulienJomier, Kitwarejulien.jomier@kitware.com