Download
1 / 1
10 likes | 104 Vues
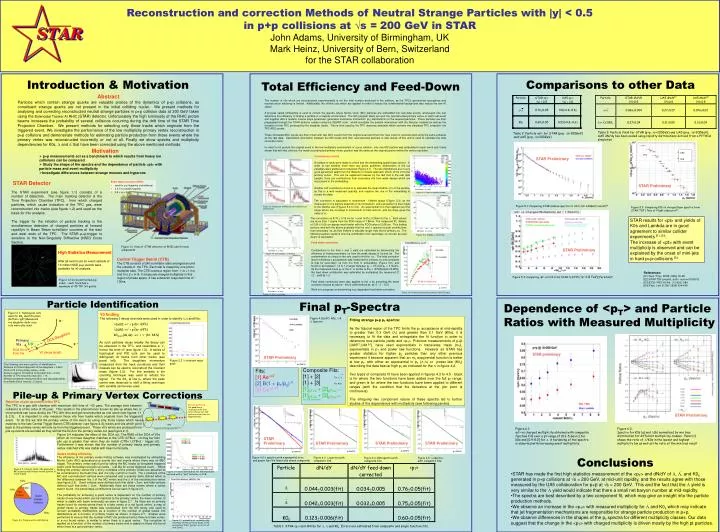
Reconstruction and correction Methods of Neutral Strange Particles with |y| < 0.5 in p+p collisions at √s = 200 GeV in STAR John Adams, University of Birmingham, UK Mark Heinz, University of Bern, Switzerland for the STAR collaboration. K. V0 finding

E N D
Reconstruction and correction Methods of Neutral Strange Particles with |y| < 0.5 in p+p collisions at √s =200 GeV in STAR John Adams, University of Birmingham, UKMark Heinz, University of Bern, Switzerlandfor the STAR collaboration K V0 finding The following 3 decay channels were used in order to identify L,L and K0s: (uds)- + p (br. 69%) (uds)+ + p (br. 69%) K0short(ds,ds) - + + (br. 64%) - As such particles decay weakly the decay can be observed in the TPC, and resembles a ‘v’, hence the term v0 (see figure 1.2). A series of topological and PID cuts can be used to distinguish v0 tracks from other tracks (see panel left). The daughters momentum (measured from the track curvature) and their masses can be used to reconstruct the invariant mass (figure 2.2). For this analysis a bin counting technique was used to extract the signal. For the K0s at low pT where the peak centre was observed to shift a fitting technique with variable centre was used. Primary Vtx V0 + DCA V0 to Prim Vtx Figure 2.2 L invariant mass peak CTB Removing Pile Up The good timing resolution of the CTB means that we can find a primary vertex from just triggered tracks. TPC Figure 2.3: Pile up in the TPC Delta (MC(z) - reco(z) Figure 2.4: DCA distribution for V0s that were matched with a “fast” detector, ie CTB. Figure 2.6: Primary vertex distribution Introduction & Motivation Comparisons to other Data Total Efficiency and Feed-Down Abstract Particles which contain strange quarks are valuable probes of the dynamics of p+p collisions, as constituent strange quarks are not present in the initial colliding nuclei. We present methods for analysing and correcting reconstructed neutral strange particles in p+p collision data at 200 GeV taken using the Solenoidal Tracker At RHIC (STAR) detector. Unfortunately the high luminosity of the RHIC proton beams increases the probability of several collisions occurring during the drift time of the STAR Time Projection Chamber. We present methods for selecting only those tracks which originate from the triggered event. We investigate the performance of the low multiplicity primary vertex reconstruction in p+p collisions and demonstrate methods for estimating particle production from those events where the primary vertex was reconstructed incorrectly or not at all. Finally we show spectra and multiplicity dependencies for K0s, L and L that have been corrected using the above mentioned methods. The number of v0s which are reconstructed experimentally is not the total number produced in the collision, as the TPC's geometrical acceptance and reconstruction efficiency is limited. Additionally, the off-line cuts which are applied in order to reduce the combinatorial background also reduce the raw v0 signal. A process called embedding is used to correct the spectra where Monte Carlo (MC) particles are embedded into real data events, whereupon one can determine the efficiency of finding a particle in a realistic environment. The MC program takes as input the reconstructed primary vertex of each real event and together with a realistic inverse slope parameter, generates transverse momentum (pT) distributions for the required particles. These particles are then propagated through the STAR detector system using the GEANT code, which simulates the particle interactions with the detector material as well as the ionisation in the TPC produced by the daughter tracks. This is then used by the TPC response simulator which converts the simulated TPC ionisation into TPC ADC counts. These simulated ADC counts are then mixed with raw ADC counts from the original event and then the ‘new’ event is reconstructed using the same software as the raw data. Association information between the MC tracks and their reconstructed partners is also stored off-line and is used to calculate the total correction factor. In order to not perturb the original event in the low multiplicity environment of a p+p collision, only one MC particle was embedded in each event and it was shown that with this criterion, the newly reconstructed primary vertex position was the same as the original position within the vertex resolution. Table 3: Particle Yield for STAR (p+p, s=200GeV) and UA5 (p+p, s=200GeV). UA5 dN/dy has been scaled using rapidity distributions derived from a PYTHIA simulation Table 2: Particle <pt> for STAR (p+p, s=200GeV) and UA5 (p+p, s=200GeV) Motivation • p+p measurements act as a benchmark to which results from heavy ion collisions can be compared • Study the shape of the spectra and the dependence of particle <pt> with particle mass and event multiplicity • Investigate differences between strange mesons and hyperons TPC ToF TPC Consistency checks A number of tests were made to check that the embedding applied was correct. In order to see whether there were any gross problems, distributions of the cut variables were plotted and compared (Figure 3.1). The two distributions are in very good agreement apart from the distance of closest approach (DCA) of the v0 to the primary vertex. This can be explained however by the fact that in the real data sample, there are contributions from secondary v0s from weak decays which are not present in the embedding. Another self consistency check is to calculate the mean lifetime (ct) of the particle, as this is a well measured quantity, and requires the use of the embedding to correct the data. The correction is calculated in momentum - lifetime space (Figure 3.3), as the measured ct of a particle depends on its momentum, and a projection is then made to the lifetime axis (Figures 3.4 to 3.6). An exponential fit is then applied over the range where the coverage in momentum is most uniform, and the slope gives the value of ct. STAR Preliminary pT Decay Length (cm) DCA daughters (cm) STAR Detector Beam-Beam Counters(BBC): • used for p-p triggering (coincidence) • ± 3.7 m outside magnets • 3.5 < |h| < 5.0 STAR Preliminary Lifetime x c (cm) DCA positive daughter to primary vertex (cm) The STAR experiment (see figure 1.1) consists of a number of detectors. The main tracking detector is the Time Projection Chamber (TPC), from which charged particles, which cause ionisation of the TPC gas, were reconstructed into tracks (see figure 1.2) and used as the basis for this analysis. The trigger for the initiation of particle tracking is the simultaneous detection of charged particles at forward rapidity's in Beam Beam scintillator counters at the east and west ends of the TPC. The STAR p+p-trigger is sensitive to the Non-Singularly Diffractive (NSD) Cross Section. DCA V0 to primary vertex (cm) Figure 3.2: 2d pt vs lambda lifetime No. Tracks when V0 passes cut DCA negative daughter to primary vertex (cm) Figure 5.1: Comparing STAR minbias spectra to UA1 (s= 630GeV) resultsE4, Figure 5.2: Comparing K0s to charged Kaon spectra from STAR TOF (Time of Flight) detectorE2. Figure 3.1: Comparison of MC(red) and real(black) cut distributions The corrected ct is 8.76 ± 0.18 cm for L and 8.40 ± 0.28cm for the L. Both values are more than 1 sigma from the PDG value of 7.89cm. The measured K0s lifetime of 2.66 ± 0.06 cm agrees much better with the PDG-value of 2.68 cm. This finding concurs well with the above postulate that the real L spectra include contributions from secondary Ls, as their lifetime is naturally longer than that of primary Ls. The following section explains how the contribution from secondary Ls (known as feed down) is calculated. STAR results for <pt> and yields of K0s and Lambda are in good agreement to similar collider experiments E1, E3. The increase of <pt> with event multiplicity is observed and can be explained by the onset of mini-jets in hard p+p-collisions E4 Lifetime x c (cm) Figure 3.3: lambda c x lifetime Feed down correction Contributions to the final L and L yield are estimated by determining the efficiency of finding secondary Ls from the weak decays of Xsand Ws.The contamination is unique to the cuts used to find the Ls. The total correction factor (efficiency x acceptance) was measured for primary Ls and compared to that for secondary Ls from X-s from X- embedding, (Figure 3.6), and found to be between 1.4 to 1.2 larger between pT = 0.3 and pT = 3 GeV/c. As the measured mean pT of the X- is similar to the L (STAR poster R.Witt), the feed down contribution was estimated by multiplying the measured X0 +X- yield by 1.3. Feed down corrections were also applied to the L by assuming the same correction factors as above - this is valid method as, as L / L ~ X//X Work is in progress on determining a pT dependent feed down correction. High Statistics Measurement After all event cuts an event sample of 10 million NSD p+p events were available for v0 analysis. Figure 1.1: View of STAR detector at RHIC and its main components STAR Preliminary Lifetime x c (cm) Figure 3.4: Anti lambda c x lifetime v0 Central Trigger Barrel (CTB) The CTB consists of 240 scintillator slats arranged around the outside of the TPC. Each slat is viewed by one photo-multiplier tube. The CTB covers a region from -1 to +1 in η and 0 to 2 pin F. It measures charged multiplicity in this region of phase space. It has a detector response time of ~ 100ns. • References: • [E1] Nucl. Phys. B328 (1989) 36-58, • [E2] STAR TOF preprint, arXiv: nucl-ex/0309012 • [E3] E735: PRD Vol 48 , 3 (1993), 984 • [E4] Phys. Lett. B 266 (1996) 434-440 Figure 5.3: Comparing <pt> vs Nch from STAR to E735 (s =1.8 TeV) (Fermilab)E3 Figure 1.2:A reconstructed p+p event - each track has a maximum of 45 TPC hit points STAR Preliminary pT (GeV/c) Lifetime x c (cm) Figure 3.6: Primary and Secondary Lambda total Efficiency Figure 3.5: K0s c x lifetime Particle Identification Final pT-Spectra Dependence of <pT> and Particle Ratios with Measured Multiplicity Figure 2.1: Topological cuts used for K0s identification. (bottom right) Measured +ve daughter dedx vs pT cuts were also used Figure 4.1(Left): K0s, L & L Spectra Fitting strange p+p pT spectra: As the fiducial region of the TPC limits the pT acceptance at mid-rapidity to greater than 0.3 GeV (L) and greater than 0.1 GeV (K0s), it is necessary to fit the data and extrapolate the fit function in order to determine true particle yields and <pT>. Previous measurements of p+p [UA5E1,UA1E4], have used exponentials in transverse mass (mT), exponentials in pT and power law functions. However as STAR has greater statistics for higher pT particles than any other previous experiment it became apparent that an mT exponential function is better at low pT, with either an exponential in pT (L,L) or power law (K0s) describing the data best at high pT, as indicated for the L in figure 4.2. Two types of composite fit have been applied in figures 4.3 to 4.5 - black is for where the two functions have been added over the full pT range, and green is for where the two functions have been applied to different ranges (with the condition that the derivative at the join point is continuous). The intriguing two component nature of these spectra led to further studies of the dependence with multiplicity (see following panels). DCA Daughters p- V0 decay length STAR Preliminary pT (GeV/c) The following cuts were used for v0 identification: Distance of Closest Approach of the daughters < 0.9cm DCA of V0 to the primary vertex < 2cm Decay Length of V0 relative to the beam line > 2.0cm Number of TPC hit points (max=45) > 15 Difference between measured dE/dx and calculated dE/dx from Bethe Bloch formula < 5 sigma Fits: [1] Ae-mT [2] B(1 + pT/p0)-n [3] Ce-pt/T2 Composite Fits: [1] + [2] For L, L [1] + [3] For K0s [1]pT<x + [2]pT>x L, L [1]pT<x + [3]pT>x K0s x is a fit parameter Pile-up & Primary Vertex Corrections Rejection of pile up events in the TPC The TPC is a gas drift chamber with maximum drift time of ~40 µsec. The average time between collisions is of the order of 25 µsec. This results in the phenomenon known as pile up where two or more events can occur during the TPC drift time and get reconstructed as one event (see figures 1.1 & 2.3). It is important to only measure those v0s from tracks which originate from the triggered event. To do this we find the primary vertex of the event by using only those tracks which have matches to the fast Central Trigger Barrel (CTB) detector (see figure 2.3); tracks and v0s which point back to the primary vertex will only be from the triggered event. Those v0’s which are produced from pile up events are avoided as they will fail the DCA to the primary vertex cut (see figure 2.1). STAR Preliminary Figure 6.2: Spectra for K0s (a) and L(b) normalised by min bias distribution for different multiplicity classes. Panel (c) shows the ratio of L/K0s in the lowest and highest multiplicity bin as well as the ratio of the min bias result Figure 6.1: <pt> vs charged multiplicity obtained with composite function fits over a pt-range of [0.2-5 Gev/c] for K0s and [0.4-5.0] for L. A hardening of the spectra is observed with increasing event multiplicity. Figure 2.4 indicates the effect of this DCA cut. The RMS of the DCA of V0s which do not have daughter matches to the CTB (CTB=0 - v0 may be from pile up) is greater than when they do match (CTB=1,CTB=2 - trigger v0). Furthermore it was shown that the number of primary tracks and primary vertex matched V0s was stable with beam luminosity. STAR Preliminary STAR Preliminary STAR Preliminary STAR Preliminary pT (GeV/c) pT (GeV/c) pT (GeV/c) pT (GeV/c) Vertex finding efficiency The efficiency of the primary vertex finding software was investigated by embedding Monte Carlo (MC) generated p+p events into real events where there was no BBC trigger. The primary vertex was found by taking the MC tracks (a ‘simulated triggered event’) and the background pile up tracks - just like for a real triggered event . When finding the primary vertex the x and y ordinates of the primary vertex are assumed to be constrained to the beam line, and it is only z which is found. The z positions of the MC and reconstructed vertices were compared and a quantity delta defined which is the difference between the z of the MC vertex and the z of the reconstructed vertex (see figure 2.5). Good vertices were defined such that delta < 2cm, and fake vertices defined such that delta > 2cm. Additionally there are those events where a vertex wasn’t found - the percentage contributions can be seen in figure 2.6. The probability for achieving a good vertex is dependent on the number of primary tracks (those tracks which can be matched to the primary vertex, the mean number of which is stable with beam luminosity) as seen in figure 2.7. As there are no primary tracks found for events where there is a fake vertex or a not found vertex, a map of global tracks to primary tracks was constructed from the MC study, and used to convert probability distributions as a function of the number of global tracks into distributions as a function of primary tracks as shown in figure 2.7. Studies were performed to ensure that the number of MC v0s produced when there is a fake vertex, or a not found vertex, is similar to when there is a good vertex. The correction is applied as a function of the number of primary tracks and is based on those v0s found when there is a good primary vertex. Conclusions Figure 4.2 Lspectra with exponential in mT and power law fits (inset also shows composite) Figure 4.3: L spectra with composite fits. Figure 4.4: K0s spectra with composite fits. Figure 4.5: Lspectra with composite fits. Figure 2.5: Study of (delta = MC generated - MC reconstructed) Primary vertex position In z-axis (beam) • STAR has made the first high statistics measurement of the <pT> and dN/dY of L, L, and K0s generated in p+p collisions at s = 200 GeV, at mid-unit rapidity, and the results agree with those measured by the UA5 collaboration for p+p at s = 200 GeV. This and the fact that the L yield is very similar to the L yield would indicate that there a small net baryon number at mid-rapidity. • The spectra are best described by a two component fit, which may give an insight into the particle production methods. • We observe an increase in the <pT> with measured multiplicity for L and K0s which may indicate that jet fragmentation mechanisms are responsible for strange particle production in p+p. • We observe differences in the shapes of the pT spectra for different multiplicity classes. Our data suggest that the change in the <pT> with charged multiplicity is driven mostly by the high pt particles. Figure 2.7: probability of reconstructing A primary vertex correctly (blue), in the wrong place “fake” (green) , or not at all (red curve) . Table 1: STAR <pT> and dN/dy forL, Land K0s Errors are estimated from composite and single function fits.