Download
1 / 71
710 likes | 910 Vues
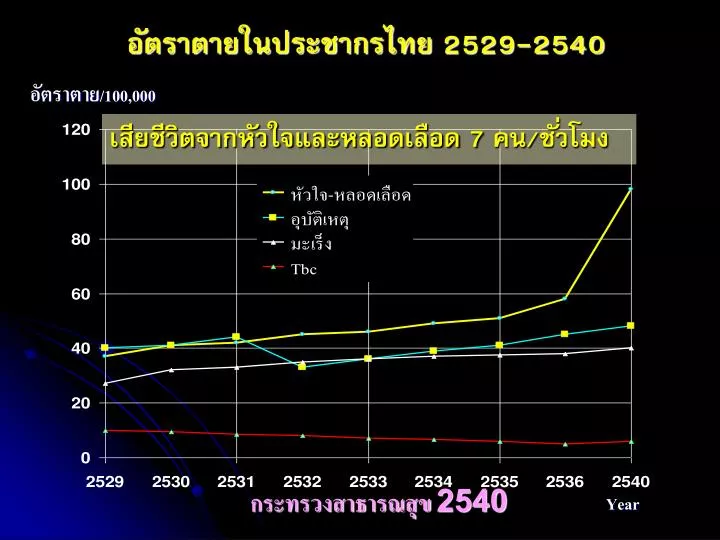
อัตราตายในประชากรไทย 2529-2540. อัตราตาย /100,000. เสียชีวิตจากหัวใจและหลอดเลือด 7 คน/ชั่วโมง. กระทรวงสาธารณสุข 2540. Year. Epidemology in Thailand. Thai people ≥ 35 yrs + Abdominal obesity = 35.8% (F=49.6%, M=20.5%) + Abdominal obesity : increase risk to DM, HYT, CHD

E N D
อัตราตายในประชากรไทย 2529-2540 อัตราตาย/100,000 เสียชีวิตจากหัวใจและหลอดเลือด 7 คน/ชั่วโมง กระทรวงสาธารณสุข 2540 Year
Epidemology in Thailand Thai people ≥ 35 yrs + Abdominal obesity= 35.8% (F=49.6%, M=20.5%) + Abdominal obesity : increase risk to DM, HYT, CHD TG > 150 mg/dl = 40.2% Hypertension > 130/85 mmHg = 34% Fasting glucose > 100 mg/dl = 29.6% สสส, กรมอนามัย กระทรวงสาธารณสุข, medical new 1-15/8/2549
THE ASIAN DISEASE: Diabetes is becoming a regional epidemic. Are you or kids-at risk?
เบาหวานคืออะไร ? อาหารที่รับประทานเข้าไปส่วนใหญ่จะเปลี่ยนเป็นน้ำตาลกลูโคสในกระแสเลือดเพื่อใช้เป็นพลังงาน และเซลล์ในตับอ่อน ชื่อ เบต้าเซลล์เป็นตัวสร้างอินซูลิน และอินซูลินจะเป็นตัวนำน้ำตาลเข้าเซลล์เพื่อใช้เป็นพลังงาน โรคเบาหวาน คือ ภาวะที่ร่างกายมีระดับน้ำตาลในเลือดสูงกว่าปกติ เกิดเนื่องจากการขาดฮอร์โมนอินซูลินหรือดื้อต่ออินซูลิน
Diagnostic Criteria for Diabetes • Symptoms of diabetes and acasual plasma glucose 200 mg/dl (11.1 mmol/l) • OR • 2. Fasting plasma glucose : FPG 126 mg/dl • (การวัดระดับกลูโคสในพลาสมาหลังการอดอาหารอย่างน้อย 8 ช.ม) • OR • 3. 2-h plasma glucose 200 mg/dl during an OGTT • (การวัดความทนน้ำตาลกลูโคส). The test should be performed as described by • the World Health Organization, using a glucose load containing the • equivalent of 75-g anhydrous glucose dissolved in water.
24-Hour Plasma Glucose Curve Normal and Type 2 Diabetic Subjects 2-h PPG 2-h PPG 2-h PPG 2-h PPG 2-h PPG 2-h PPG Diabetic 400 300 Glucose(mg/dL) 200 140 Normal 100 Meal Meal Meal 0 0600 1000 1400 1800 2200 0200 0600 Time of Day Adapted from Polonsky et al, N Engl J Med 1988.
Type of Diabetes 1.Type 1 Diabetes 2.Type 2 Diabetes 3. Gestational diabetes
Type 2 Diabetes • มีประวัติของการเป็นเบาหวานระหว่างตั้งครรภ์ • มีภาวะของ impaired glucose tolerance <IGT> • คนที่เป็นเบาหวาน 90 % เป็นเบาหวานชนิดที่ 2 • อาการเหมือนกับเบาหวานชนิดที่ 1 • เกิดหลังจากอายุ 30 – 40 ปี • อ้วน Obesity • มีประวัติครอบครัวเป็นเบาหวาน
Gestational diabetes Geatational diabetes เป็นการเกิดโรคเบาหวานแบบชั่วคราว ซึ่งพบในกลุ่มของตั้งครรภ์ และอาการก็จะหายไปเองหลังจากคลอด “ รักษาโดยการ diet และการใช้ insulin ” risk : มีโอกาสในการพัฒนาเป็น impaired glucose (IGT ) หรือ type 2 diabetes.
Criteria for Diagnosis of DM Normal < 100 < 140 IFG 100 < 126 IGT 140 < 200 DM > 126 > 200** Fasting Plasma Glucose (FPG) (mg/dL) Random Plasma Glucose (mg/dL)** Stage * Testing must be repeated on separate day . FPG is the preferred test ** Symptoms of DM IFG = Impaired fasting glucose IGT = Impaired glucose tolerance ADA.2004
Criteria for Diagnosis of DM Normal < 100 < 140 IFG 110 < 126 IGT 140 < 200 DM > 126 > 200** Fasting Plasma Glucose (FPG) (mg/dL) Random Plasma Glucose (mg/dL)** Stage Pre-Diabetes * Testing must be repeated on separate day . FPG is the preferred test ** Symptoms of DM IFG = Impaired fasting glucose IGT = Impaired glucose tolerance ADA.2004
Prevalence of Diabetes in Thailand(population aged ≥35 yrs) Percent IFG 5.9% Data provided by Wichai Aekplakorn
Prevalence of Diabetes in Thai Adults 18 P e r c e n t 16 Total DM 14 Known DM 12 IFG 10 8 6 4 2 0 A g e Overall >65 35-44 45-54 55-64 The Burden of Diabetes in Thailand Rising prevalence of diabetes in Thailand ( age > 35 year ) from 5.7% (1991) to 9.6% ( 2000 ) Aekplakorn W. Diabetes Care 2003; 26: 2758-63
เป้าหมายในการรักษาโรคเบาหวานเป้าหมายในการรักษาโรคเบาหวาน 1. ควบคุมระดับน้ำตาลในเลือดให้ใกล้เคียงปกติ 2. ป้องกันโรคแทรกซ้อนเฉียบพลัน และเรื้อรัง 3. มีการดำรงชีวิตที่ปกติเหมือนคนทั่วไป 4. มีการเจริญเติบโตปกติ
Risk of MI is increased in type 2 diabetes Type 2 Diabetes is a CHD Risk FactorDiabetes and Prior MI Predict Mortality Equally * 50% 45.0% No prior MI 40% Prior MI 30% Risk of fatal or nonfatal MI * 20.2% 18.8% 20% 10% 3.5% 0% Non-diabetic subjects (n = 1373) Type 2 diabetic subjects (n = 1059) Seven-year incidence in a Finnish-based cohort. *P < 0.001 Adapted from Haffner SM. New Engl J Med 1998; 339: 229–34.
Hyperglycemia/ Hypoglycemia Microvascular Retinopathy:Glaucoma and cataracts Nephropathy Neuropathy Macrovascular Myocardial infarction (MI) Cerbrovascular accident(CVA): stroke, TIA Periperal vascular disease Increase risk of infection Complications of Diabetes
Decline of -Cell Function in the UKPDS Illustrates Progressive Nature of Diabetes Time of diagnosis 100 ? 80 60 -Cell function (% of normal by HOMA) Pancreatic function = 50% of normal 40 20 0 –10 –9 –8 –7 –6 –5 –4 –3 –2 –1 0 1 2 3 4 5 6 Time (y) UKPDS=United Kingdom Prospective Diabetes Study; HOMA=homeostasis model assessment. Adapted from Holman RR. Diabetes Res Clin Pract. 1998;40(suppl):S21-S25. U.K. Prospective Diabetes Study Group. Diabetes. 1995;44:1249-1258.
Progression of type2diabetes Preclinical state Clinical state Normal IGT IFG Type 2DM Complications Disability Death Primary prevention Secondary prevention Tertiary prevention
สถานภาพทางเศรษฐกิจและสังคมสถานภาพทางเศรษฐกิจและสังคม
การติดตามปัจจัยเสี่ยงและประเมินภาวะแทรกซ้อนการติดตามปัจจัยเสี่ยงและประเมินภาวะแทรกซ้อน
การใช้ยาในผู้ป่วยเบาหวานการใช้ยาในผู้ป่วยเบาหวาน
Number 0f Subject N = 9,419 (expected sample size = 8360 cases)
Other 0.5% Type1 4.5% Uncertain 0.4% F = 65.9% Type2 94.6% M= 34.1% Results Mean age 59.4 ± 13.5 years Mean duration 10 ± 7.6 years 6 cases of MODY N= 9,419
Achievement of Control percentage 100 8.2± 1.9 80 154± 56 114 ±36 69.3% 61.8% 63.3% 197± 42.5 60 151 ± 105 43.8% 54± 15 37.2% 40 32.2% 1.2± 0.9 20 5% 0 FPG > 130 HbA1C > 7 Cr >2 T_Chol > HDL<40 LDL>100 TG > 150 200
Co-morbidity in The Metabolic Syndrome 73.3% 63.3%
Diabetes Complication in the Thailand Diabetes Registry N = 9,419
Nephropathy 43.9% RI 8.3 % N=5,145 No Prot. 17.8 % No 56.1 % UMA UMA 17.8 % Proteinuria Renal Impairment NA= 4274/9419 (45.4%)
No NPDR PDR Retinopathy 31.4% PDR 9.4 % N= 7,119 NDPR 21.3 % No 69.3% NA 2,300/9,419 (24.4%) Blindness from DM 118/8,128 (1.5 %)
ผู้หญิงอายุ 50 ปี เป็นเบาหวานมา 5 ปี น้ำหนัก 50 Kg Cr 1.5 CrCl = (140 – age) x BW 72xScr Female = CrCl x 0.85 = 140 – 50 x (50) 72 x 1.5 = 41.6 = 41.6 x 0.85 CrCl = 35 ** มี urine protein 1+ จะเป็นไตวายในเวลากี่ปี
Frequency of complication measured: community hospital Low A1 checked Nitiyanant J Med Assoc Thai 2007;90; 65-71
DM 2003 DM 2008 Outpatients with type 2 DM in Maharat NakhonRatchasima Hospital Target ADA/EASD for DM management 80 70 60 50 40 percentages 30 20 10 0 SBP<130 mmHg DBP<80 mmHg FBS<130 mg/dl TChol<200 mg/dl TG<150 mg/dl HDL > 40 in male >50 in female HbA1c< 7% LDL<100 mg/dl
CODE-2: effect of complications on costs Total costs (€) Costs due to hospitalization (%) Increase in costs vs. no complications 6,000 247% 5,000 5,226 4,000 109% Cost (€) 60% 70% 3,000 3,148 2,563 2,000 56% 1,505 46% 1,000 38% 0 Micro-vascular No complications Macro-vascular Both micro and macro Williams R, et al. Diabetologia 2002; 45:S13–S17. Complication costs driven by hospitalization
Diabetes: the cost to society Direct costs breakdown4 Hospitalinpatient care 44% Nursing home care 15% 5% 11% 6% Physician office visits 8% Insulin and supplies Non-diabeticoutpatient medication Estimated US costs $132 140 • Cost of diabetes care in Thailand • IPD • 2546-47: 41,950 – 42,921b/case 11,827.2 mBaht/year • 2548: 11,828 b/case 3,259.3 mBaht/year (MOPH) • OPD • 2546: 9,033 baht/case 11,200,9 mBaht/year 120 Indirect costs $98 $92 100 80 Cost per year (US$ billion) 60 Direct costs 40 $20 20 Oral anti-diabetic agents 0 20024 19861 19922 19973 Year 1Huse DM, et al. JAMA 1989; 262:2708–2713. 2Ray NF, et al. ADA, 1993. 3ADA. Diabetes Care 1998; 21:296–309. 4ADA. Diabetes Care 2003; 26:917–932.
None Hypertension only Diabetes only Hypertension and diabetes Dyslipidaemia only Dyslipidaemia+hypertension +/-diabetes 120 100 80 Incidence of MI/1000 pts 60 40 20 0 Prevalence (%): 54.9 22.9 2.6 2.3 9.4 8.0 Combination of Risk Factors Increases Risk of MI: PROCAM Assmann G, Schulte H. Am Heart J 1988;116:1713–1724.
Staged Diabetes Management Diabetes Hyperglycemia Lipid Disorders Hypertension Microvascular Complications Other Components of Care
Assaults on the Vascular Bed in Diabetes Diabetes Hyperglycemia Lipid Disorders Hypertension Microvascular Complications Other Components of Care Vascular Bed
Outcome Worse Outcome Better Cost Lower No! Cost Higher Targets in Type 2 DM • HbA1c < 7% • LDL-C < 100 mg/dl • HDL-C > 40 mg/dl • Triglyceride < 150 mg/dl • BP < 130/80 mmHg
Diabetes Control and Complicaion Trial(DCCT) • total of 1441 patients with IDDM ,mean follow up 6.5 years • intensive therapy: externalinsulin pump or by three or more daily insulin injections andguided by frequent blood glucose monitoring • conventionaltherapy with one or two daily insulin injection • Endpoint: The patientswere ed for a, and the appearance andprogression of retinopathy and other complications were assessedregularly. • ResultsIn the intensive therapy vs conventional therapy. • :primary-prevention: reduce risk of development of retinopathyby 76 % • : secondary-intervention: progression of retinopathy 54 % • : reduced microalbuminuria 39 % • : reduced neuropathy by 60 % • The chief adverse event associatedwith intensive therapy was a two-to-threefold increase in severehypoglycemia. • Conclusions Intensive therapy effectively delays the onset andslows the progression of diabetic retinopathy, nephropathy,and neuropathy in patients with IDDM. • NEJM: Volume 329:977-986 September 30, Number 141993
UKPDS:decreased risk of diabetes-related complications associated with a 1% decrease in A1C †Lower extremity amputation or fatal peripheral vascular disease *P = 0.035; **P < 0.0001 Observational analysis from UKPDS study data Any diabetes- related endpoint Diabetes- related death All cause mortality Peripheral vascular disease† Micro- vascular disease Myocardial infarction Cataract extraction Stroke Percentage increase in relative risk corresponding to a 1% rise in HbA1C 12% 14% 14% * 19% ** 21% 21% ** ** ** ** 1% reduction in A1C would reduce the risk of microvascular complications by 37%,but have less effect (14%) on macrovascular complications 37% 43% ** ** Adapted from Stratton IM, et al. UKPDS 35. BMJ 2000; 321:405–412.
Glycemic Control - Intervention StudiesMicro and Macrovascular Complications Reduction in risk with intensive therapy UKPDS (Type 2) 17-21% 24-33% - 16%* (p=0.052) Retinopathy Nephropathy Neuropathy Cardiovascular disease DCCT (Type 1) 63% 54% 60% 41%* (p=0.06) Kumamoto (Type 2) 69% 70% - - DCCT Research Group. N Engl J Med. 1993;329:977-986. Ohkubo Y, et al. Diabetes Res Clin Pract. 1995;28:103-117. UKPDS 33: Lancet 1998; 352, 837-853.
Treatment Glucose lowering HTN Hyperlipidemia Aspirin therapy Metformin (ins. resistance) CVD in DiabetesTherapies that Make a Difference CVD Benefit CV events 15-40% CV mortality 25-54% CV risk 25-55% CV events by 20-61% MI by 25%
GOAL Goal Plasma glucose - Average preprandial PG (mg/dl) 90-130 - Peak postprandial PG (mg/dl) <180 - HbA1C (%) <7 Lipid - Total Chol (mg/dl) <200 (180) - Triglyceride (mg/dl) <150 - HDL-C (mg/dl) >40 - LDL-C : - age <40, total chol >135 + risk factor < 100 mg/dl - age >40, total chol >135 , 30-40% of LDL-C (< 100) - overt CVD ( very high risk) <70 BP (mmHg) <130/<80 ADA 2005
UKPDS: Glycemic Control Study 5,102 patients treated with diet (3 months) 4,209 patients randomized (82%) Conventional therapy (n=1,138) Initial therapy - medical nutrition Target FPG < 270 mg/dL (13.5 mmol/L) Intensive therapy (n=3,071) *Initial drug monotherapy Target FPG < 108mg/dL (6 mmol/L) Mean duration of follow-up 11 years Metformin Overweight only n=342 Sulfonylureas Initial therapy n=1573 Insulin Single-multi injection n=1156 * These therapies were combined or changed to maintain target UKPDS Group: Lancet 1998; 352, 837-853.