Download
1 / 200
2.07k likes | 2.42k Vues
Global Auto Industry. Franklin Guo Dat Hong Rex Liu Reya Lu. Auto Manufacturing Industry Agenda. Auto Manufacturing History & Regulation Business Strategy & Characteristics Global Auto Supply Chain Global Auto Sales & Production Analysis Industry Future Forecast.

E N D
Global Auto Industry Franklin Guo Dat Hong Rex Liu Reya Lu
Auto Manufacturing Industry Agenda • Auto Manufacturing History & Regulation • Business Strategy & Characteristics • Global Auto Supply Chain • Global Auto Sales & Production Analysis • Industry Future Forecast
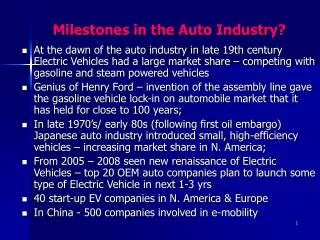
Auto Manufacturing History Eras of Invention (late 17th century – 1890s): • A small steam car was demonstrated in 1678 The early automobiles manufacturing companies: Panhard et Levassor, Oldsmobile, Cadillac, Winton, Ford, etc. • After 1930, the number of auto manufacturers declined sharply as the industry consolidated and matured. • By 1960s, foreign competition arose as Japanese appeared as a serious auto manufacturing nation. • Captive imports and badge engineering swept through the U.S. and UK, resulting in major acquisitions and merges by the end of 1960s.
Auto Manufacturing History • As the 1973 oil crisis, automobile emissions control rules, Japanese and European imports, and stagnant innovation changed American industry. • Small imported cars outperformed large American ones, and the domestic auto industry began to fail. Small performance cars from BMW, Toyota, and Nissan took the place of big-engined cars from America and Italy. • Major M & A, alliance: GM---SAAB, Daewoo; Isuzu, Subaru, Suzuki Ford---Jaguar, Land Rover, Volvo; Mazda Benz---Chrysler Renault---Nissan
Regulation History • Emission Regulation Act • Since 1970, emissions from motor vehicles were regulated by Transport Canada under the authority of the Motor Vehicle Safety Act (MVSA) and it was later amended in 1993. • In 1999, with the passage of the proposed amendment to the Canadian Environmental Protection Act (CEPA), automotive emissions regulations have become the responsibility of Environment Canada. • In 2001, Canadian government published the Canada Gazette Part I to develop and implement services and measures over the next decade to further protect the health of Canadians and the environment by reducing emissions from vehicles, engines and fuels.
Porter’s Model for Automakers • Barriers to entry • Weak supplier power • The threats to substitute products is low However, are offset by • Strong rivalry among competitors • Bargaining power of consumers
Auto Suppliers • Facing a number of challenges including: • A lack of pricing power, high labor costs, decreasing volume and increasing raw material costs; • NAFTA-only suppliers are losing market shares to global suppliers. • Suppliers are trying to increase value-added content, supply systems instead of components, technology innovations, etc. • Acquisitions, joint ventures, etc.
Changes in Gas Price vs. SUV & Hybrid Auto Sales • Gasoline price has a positive correlation with the sales of hybrid auto and a negative correlation with the sales of SUV.
Global Auto Sales http://www.scotiacapital.com/English/bns_econ/bns_auto.pdf
Manufacturers’ Unit Price Comparison • On average, vehicles from US car makers were sold for $21,597 in 2005, which was 13% below the comparable sales price for the Japanese car makers’. It was mainly due to: • Missed design opportunities • Heavy employee-level discounting • Higher labor costs
Manufacturers’ Operating Margins Comparison • US automakers’ operating margins are lower than their major competitors’.
Cost Structure – Health & Pension • The U.S. “Big Three” reported that pension and health cost them $1,500 per vehicle produced currently.
Interoperability Costs • Imperfect interoperability impose costs due to higher costs of design and production and slower implementation of design changes.
Global Production 59.8 million Global Production 74.6 million Asia Pacific will lead in production volumes by 2011 • European production levels will grow at 2% and most of it in Central Europe, Turkey and Russia. • North American growth will be coming from transplant operations of Korean, Japanese and German OEM’s. • China will expand its production base at an average annual rate of 12%. Exports of Chinese cars to Europe and US will commence by 2008- 2009. • South America will see recovery and growth specifically in Brazil. 2004 2011 Source: CSM Auto Production Forecast
Emission Standards Comparison • “ACEA agreement”is a voluntary agreement between European automobiles manufacturers association and the European Commissions. Its goal is to reduce 25% of 1995’s level of vehicle CO2 emissions by 2008. Automakers are questioned for failing to deliver the emissions cut. - Japan automakers joined the agreement later and aimed to reduce 23% in vehicle CO2 emissions by 2010 (from 1995 levels). • Australia: voluntary commitment to improve fuel economy by 18% by 2010. • Canada: has proposed a 25% improvement in fuel economy by 2010. • China: Introduced new fuel economy standards in 2004; weight-based standards to be introduced in 2 phases (2005 and 2008). • California: CARB approved GHG emissions reductions for automobiles, currently under legislative review. • New York: Clean Cars Bill proposing to follow California standards is currently in committee. Several other NE states have indicated they will follow CA’s lead.
Emission Standards Comparison However, automakers are questioned for failing to deliver the emissions cut. Nissan, Suzuki, Mazda, Audi, Volvo, BMW and Volkswagen are the worst performers among a group of 20 manufacturers surveyed by the Institute for European Environmental Policy (IEEP) for T&E, the European Federation for Transport and the Environment. There will be additional manufacturing associated with CO2 emission constraints.
BMW GroupSymbol : Common [BMW] Preferred [BMW3]Primary Exchange: FrankfurtCurrency: Euro ($1 EUR = $1.27 USD) Key Share Information:
Common Stock Price (BMW)[Price in Euros] Last: $43.92 Change: $ -0.16 %Change: -0.36 Date: Nov. 23, 2006 Open: 44.10 Bid: N/A High: 44.36 Ask: N/A Low: 43.86 EPS: 4.23 Volume: 21,311 P/E: 10.43 52 Week 52 Week High: 45.97 Low: 35.68 Yield: 1.45% Beta: 0.80 Dividend per share: 0.64
BMW Common Stock 5 Year Performance Source: Deutsche Börse AG / Interactive Data Managed Solutions
BMW Common Stock 1 Year Performance Source: Deutsche Börse AG / Interactive Data Managed Solutions
Preferred Stock Price (BMW3)[Price in Euros] Last: $43.64 Change: -$0.25 %Change: -0.56 Date: Nov. 23, 2006 Open: 44.00 Bid: N/A High: 44.04 Ask: N/A Low: 43.28 EPS: 4.23 Volume: 3,367 P/E: 10.71 52 Week 52 Week High: 45.01 Low: 31.95 Yield: 1.50% Beta: N/A Dividend per share: 0.66
BMW Preferred Stock 5 Year Performance Source: Deutsche Börse AG / Interactive Data Managed Solutions
BMW Preferred Stock 1 Year Stock Performance Source: Deutsche Börse AG / Interactive Data Managed Solutions