Download
1 / 24
240 likes | 542 Vues
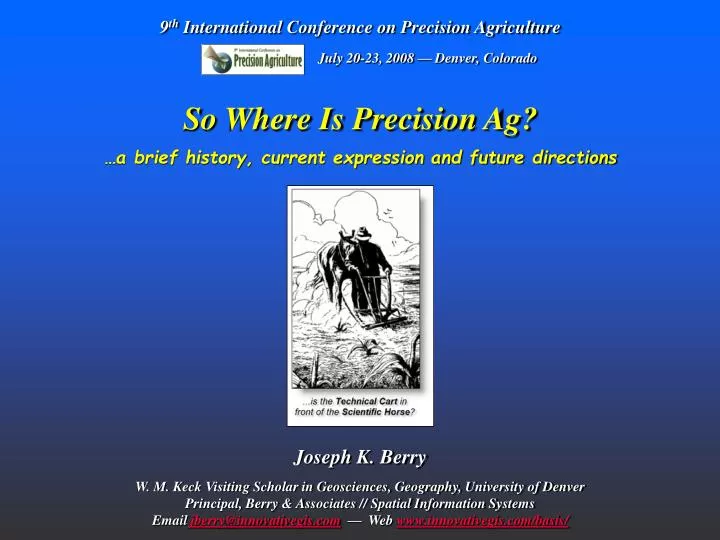
9 th International Conference on Precision Agriculture July 20-23, 2008 — Denver, Colorado So Where Is Precision Ag? …a brief history, current expression and future directions

E N D
9th International Conference on Precision Agriculture July 20-23, 2008 — Denver, Colorado So Where Is Precision Ag? …a brief history, current expression and future directions Joseph K. BerryW. M. Keck Visiting Scholar in Geosciences, Geography, University of DenverPrincipal, Berry & Associates // Spatial Information SystemsEmail jberry@innovativegis.com — Web www.innovativegis.com/basis/
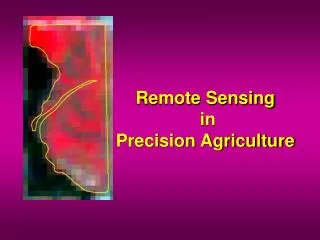
Things to keep in mind— PA is about doing the right thing at the right place and at the right time …it identifies and responds to the variability within a field …it augments indigenous knowledge (not a replacement) (PA has been around awhile, Circa 1992) …it is a radically different technology with extremely high expectations What Is Precision Agriculture? (Berry)
8,000 years of mapping Computer Mappingautomates the cartographic process (70s) Spatial Database Managementlinks computer mapping techniques with traditional database capabilities (80s) …CM + SDBM of the first two decades is often referred to asDesktop GIS Mapping and Inventory — What is Where Map Analysis — Why and So What Map Analysisrepresentation of relationships within and among mapped data (90s) Toolbox supporting Precision Ag…focus of this presentation Historical Setting and Evolution Multimedia Mappingfull integration of GIS, GPS, RS, Internet and visualization technologies (00s) Note: U.S. Dept. of Labor identifiesGeotechnology(GPS, GIS, RS)as one of three "mega technologies" for the 21st century and promises to change how we conceptualize, utilize and visualize spatial relationships in scientific research and commercial applications (the other two are Biotechnology and Nanotechnology) (Berry)
Water • Weather • Topography • Nutrients • Weeds • Pests • Genetics • Seeding Rate • Other… On-Farm Studies (Research?) • Candidate for Precision Agriculture andSite-specific Management • if and only if — • the factor is asignificantdriving variable • it hasmeasurablespatial variability • its variability can be explained andspatial relationships established • it exhibits aspatial responseto practical management actions …and results in production gains, increased profitability and/or improved stewardship Yield Limiting Factors (the basis of PA) (Berry)
Whole-fieldassumes the “average” conditions are the same everywhere within the field (uniform/homogenous) Management action is the same throughout the field Discrete Management Zones break the field into areas of similar conditions (zones) Management action is the same within each zone Z2 Continuous Surfacesbreak the field into small consistent pieces (cells) that track specific conditions at each location Z1 Z1 Z3 Management action varies throughout the field Z2 Whole Field vs. Site Specific Management The bulk of agricultural research has been “non-spatial” …but PA is all about spatial relationships/patterns Research Opportunity Is Smart Sampling really dumb? (Berry)
Shading Manager Click on… Zoom Pan Rotate Display Analysis Frame(Grid ) …each map layer is organized as a geo-registeredmatrix of numbers : --, --, --, --, --, --, --, --, --, --, --, --, --, 149.0, --, --, --, --, --, : Grid Table Map Stack Continuous regular grid cells (objects) MAP Analysis Framework (Keystone Concept) (Berry)
Grid-Based Map Analysis (workshop topics) • Surface Modelingmaps the spatial distribution and pattern of point data… • Map Generalization— characterizes spatial trends (tilted plane) • Spatial Interpolation— deriving spatial distributions (e.g. IDW, Krig) • Other— roving windows and facets (e.g., density surface; tessellation) • Spatial Data Mininginvestigates the “numerical” relationships in mapped data… • Descriptive— aggregate statistics (e.g. average, stdev, similarity; clustering) • Predictive— relationships among maps (e.g., regression) • Prescription— appropriate actions (e.g., decision rules; optimization) • Spatial Analysisinvestigates the “contextual” relationships in mapped data… • Reclassify— reassigns map values (position, value, size, shape, contiguity) • Overlay— map coincidence (point-by-point; region-wide; map-wide) • Distance— proximity and connection (movement; optimal paths; visibility) • Neighbors— roving windows (slope; aspect; diversity; anomaly) Surface Modeling Techniques (Berry)
Geographic Distribution(Mapping the Variance) Numeric Distribution — Average, Standard Deviation Continuous Surface —Geographic Distribution The “iterative smoothing” process is similar to slapping a big chunk of modeler’s clay over the “data spikes,” then taking a knife and cutting away the excess to leave a continuous surface that encapsulates the peaks and valleys implied in the original field samples (Berry)
Spatial Interpolation maps the geographic distribution inherent in the data Corn Field Phosphorous (P) Data “Spikes” IDW Surface Spatial Interpolation (soil nutrient levels) (Berry)
Comparison of the IDWinterpolated surface to the whole field average shows large differences in localized estimates (-16.6 to 80.4 ppm) Comparison of the IDW interpolated surface to the Krig interpolated surface shows small differences in localized estimates (-13.3 to 11.7 ppm) Comparing Spatial Interpolation Results (Berry)
Grid-Based Map Analysis (workshop topics) • Surface Modelingmaps the spatial distribution and pattern of point data… • Map Generalization— characterizes spatial trends (tilted plane) • Spatial Interpolation— deriving spatial distributions (e.g. IDW, Krig) • Other— roving windows and facets (e.g., density surface; tessellation) • Spatial Data Mininginvestigates the “numerical” relationships in mapped data… • Descriptive— aggregate statistics (e.g. average, stdev, similarity; clustering) • Predictive— relationships among maps (e.g., regression) • Prescription— appropriate actions (e.g., decision rules; optimization) • Spatial Analysisinvestigates the “contextual” relationships in mapped data… • Reclassify— reassigns map values (position, value, size, shape, contiguity) • Overlay— map coincidence (point-by-point; region-wide; map-wide) • Distance— proximity and connection (movement; optimal paths; visibility) • Neighbors— roving windows (slope; aspect; diversity; anomaly) Spatial Data Mining Techniques (Berry)
Interpolated Spatial Distribution Phosphorous (P) What spatial relationships do you see? Visualizing Spatial Relationships …do relatively high levels of P often occur with high levels of K and N? …how often? …where? HUMANS can “see” broad generalized patterns in a single map variable (Berry)
COMPUTERS can “see” detailed patterns in multiple map variables Clustering Maps for Data Zones …groups of “floating balls” in data space identify locations in the field with similar data patterns– data zones (Berry)
The Precision Ag Process(Fertility example) As a combine moves through a field 1) it uses GPS to check its location then 2) checks the yield at that location to 3) create a continuous map of the yield variation every few feet (dependent map variable). Steps 1–3) “As-applied” maps On-the-Fly Yield Map Intelligent Implements Prescription Map Step 4) Step 5) Derived Nutrient Maps Zone 3 Zone 2 The yield map 4) is analyzed in combination with soil, terrain and other maps (independent map variables) to derive a “Prescription Map” … Variable Rate Application Zone 1 5) …that is used to adjust fertilization levels every few feet in the field (action). …more generally termed the Spatial Data Mining Process(e.g., Geo-Business application) (Berry)
Data Analysis Perspectives (Data vs. Geographic Space) Traditional Analysis Map Analysis (Data Space — Non-spatial Statistics) (Geographic Space — Spatial Statistics) Field Data Standard Normal Curve fit to the data Spatially Interpolated data Central Tendency Average = 22.0 StDev = 18.7 Typical How Typical Discrete Spatial Object (Generalized) Continuous Spatial Distribution (Detailed) 22.0 28.2 Identifies the Central Tendency Maps the Variance (Berry)
Yield Mapping…done deal for many crops Soil Nutrient Mapping…procedures need validation Mgt Zone Mapping…alternative approaches need study & validation PA Nugget So Where Are We in Precision Ag? • The Full Precision Farming Process…a fair piece to go • IF <condition> THEN <action>…based on spatial relationships • Description (Where is What) …coming on line • Prediction (Why and So What) …needs lots of work • Prescription (Do What Where)…barely on the research radar • Action (Precisely Here) …done deal for many farm inputs (Berry)
Grid-Based Map Analysis (workshop topics) • Surface Modelingmaps the spatial distribution and pattern of point data… • Map Generalization— characterizes spatial trends (tilted plane) • Spatial Interpolation— deriving spatial distributions (e.g. IDW, Krig) • Other— roving windows and facets (e.g., density surface; tessellation) • Spatial Data Mininginvestigates the “numerical” relationships in mapped data… • Descriptive— aggregate statistics (e.g. average, stdev, similarity; clustering) • Predictive— relationships among maps (e.g., regression) • Prescription— appropriate actions (e.g., decision rules; optimization) • Spatial Analysisinvestigates the “contextual” relationships in mapped data… • Reclassify— reassigns map values (position, value, size, shape, contiguity) • Overlay— map coincidence (point-by-point; region-wide; map-wide) • Distance— proximity and connection (movement; optimal paths; visibility) • Neighbors— roving windows (slope; aspect; diversity; anomaly) Spatial Analysis Techniques (Berry)
Determining Erosion Potential: slope and flow classes are combined into a single map identifying erosion potential times 10 plus renumber Field Elevationis formed by assigning an elevation value to each cell in an analysis grid (1cm Lidar) Micro Terrain Analysis(a simple erosion model) (Berry)
Precision Conservation (Farm, Watershed,… Focus) Precision Ag (Individual Field Focus) Wind Erosion Chemicals SoilErosion Terrain Runoff Leaching Soils Leaching Leaching Yield Potassium 3-dimensional CIR Image (Stewardship Focus) (Production Focus) 2-dimensional Interconnected Perspective Isolated Perspective Precision Conservation(compared to Precision Ag) (Berry)
Deriving Erosion Potential(regional scale) Maps of surface flow confluence and slope are calculated by considering relative elevation differences throughout a project area (Berry)
Calculating Effective Distance(variable-width buffers) Effective erosion buffers around a stream expand and contract depending on the erosion potential of the intervening terrain (Berry)
Revisit Analytics (2020s) Multimedia Mapping (2000s) 2D Planar (X,Y Data) 3D Solid (X,Y,Z Data) Revisit Geo-reference (2010s) Square (4 sides) Hexahedron (6 squares) Map Analysis(1990s) Spatial dB Mgt(1980s) Hexagon (6 sides) Dodecahedron (12 pentagons) Mapping focus Computer Mapping (1970s) Data/Structure focus Analysis focus Cyclical Development(future directions) Future Directions Contemporary GIS The Early Years
Five critical questions underlying Precision Agriculture… 1)Is the “scientific method” relevant in the data-rich age of knowledge engineering? Is GIS Technology Ahead of Science? 2)Is the “random thing” pertinent in deriving mapped data? 3)Are geographic distributions a natural extension of numerical distributions? 4)Can spatial dependencies within a map variable (spatial autocorrelation) and among map variables (spatial correlation) be modeled? 5)How can “site-specific” analysis and on-farm studies contribute to the scientific body of knowledge? (Berry)
www.innovativegis.com/basis/ Online References Analyzing Precision Ag Data …workbook with hands-on exercises Textbook Presentation handout Workbook Where To Go From Here…