Download
1 / 42
420 likes | 527 Vues
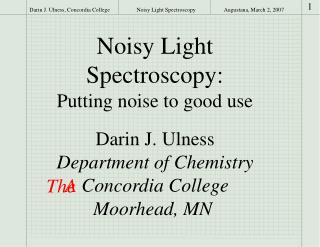
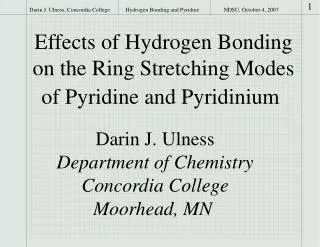
1. Darin J. Ulness, Concordia College. Noisy Light Spectroscopy. Noisy Light Spectroscopy: Putting noise to good use. Darin J. Ulness Department of Chemistry Concordia College Moorhead, MN. 2. Darin J. Ulness, Concordia College. Noisy Light Spectroscopy. Outline. Introduction Theory

E N D
1 Darin J. Ulness, Concordia College Noisy Light Spectroscopy Noisy Light Spectroscopy: Putting noise to good use Darin J. Ulness Department of Chemistry Concordia College Moorhead, MN
2 Darin J. Ulness, Concordia College Noisy Light Spectroscopy Outline • Introduction • Theory • III. Experiment • Coherent Raman Scattering • IV. Connections
3 Darin J. Ulness, Concordia College Noisy Light Spectroscopy Spectroscopy Using light to gain information about matter Information Uses of information • In Chemistry • In Biology • In Engineering • Lineshape function • Transition frequencies • Cross-sections • Susceptibilities
4 Darin J. Ulness, Concordia College Noisy Light Spectroscopy Modern Spectroscopy Frequency Domain Time Domain • Measure Spectra • Examples • IR, UV-VIS, Raman • Material response • Spectrally narrow • Temporally slow • Response to light pulse • Examples • PE, transient abs. • Material response • Spectrally broad • Temporally fast
4 Darin J. Ulness, Concordia College Noisy Light Spectroscopy Modern Spectroscopy Frequency Domain Time Domain • Measure Spectra • Examples • IR, UV-VIS, Raman • Material response • Spectrally narrow • Temporally slow • Response to light pulse • Examples • PE, transient abs. • Material response • Spectrally broad • Temporally fast
4 Darin J. Ulness, Concordia College Noisy Light Spectroscopy Modern Spectroscopy Frequency Domain Time Domain • Measure Spectra • Examples • IR, UV-VIS, Raman • Material response • Spectrally narrow • Temporally slow • Response to light pulse • Examples • PE, transient abs. • Material response • Spectrally broad • Temporally fast Is there another useful technique? Noisy light? YES!
5 Spectrum One frequency (or color) frequency time Darin J. Ulness, Concordia College Noisy Light Spectroscopy Light • Electromagnetic radiation • Focus on electric field part
6 Time resolution on the order of the correlation time, tc Noisy Light Spectrum Frequency Darin J. Ulness, Concordia College Noisy Light Spectroscopy Noisy Light: Definition • Broadband • Phase incoherent • Quasi continuous wave
7 Darin J. Ulness, Concordia College Noisy Light Spectroscopy Noisy Light: Alternative • Its cw nature allows precise measurement of transition frequencies. • Its ultrashort noise correlation time offers femtosecond scale time resolution. • It offers a different way to study the lineshaping function. • It is particularly useful for coherent Raman scattering. • Other spectroscopies: photon echo, OKE, FROG, polarization beats…
8 Noisy Light Spectroscopy Optical coherence theory Perturbation theory: Density operator Darin J. Ulness, Concordia College Noisy Light Spectroscopy Theory
9 Difficulty • The cw nature requires all field action permutations. The light is always on. • The proper treatment of the noise cross-correlates chromophores. Darin J. Ulness, Concordia College Noisy Light Spectroscopy Theoretical Challenges • Complicated Mathematics • Complicated Physical Interpretation
10 Solution • Factorized time correlation (FTC) diagram analysis Darin J. Ulness, Concordia College Noisy Light Spectroscopy Bichromophoric Model a Noisy light (3) P(t) < > (3)* P(s) b
11 Messy integration and algebra Construction Rules Evaluation Rules Set of intensity level terms (pre-evaluated) Set of FTC diagrams Set of evaluated intensity level terms easy Physics hard hard Darin J. Ulness, Concordia College Noisy Light Spectroscopy FTC Diagram Analysis
12 a P(t,{ti}) b P(s,{si}) Darin J. Ulness, Concordia College Noisy Light Spectroscopy Example: I(2)CARS arrow segments: t-dependent correlation line segments: t-independent correlation
13 Darin J. Ulness, Concordia College Noisy Light Spectroscopy Experiment • Coherent Raman Scattering: e.g., CARS • Frequency resolved signals • Spectrograms • Molecular liquids
14 Material Signal Light field P(t) = P(1) + P(2) + P(3) … P(1) = c(1)E, P(2) = c(2)EE, P(3) = c(3)EEE Darin J. Ulness, Concordia College Noisy Light Spectroscopy Nonlinear Optics P= c E Perturbation series approximation
15 Darin J. Ulness, Concordia College Noisy Light Spectroscopy CARS Coherent Anti-Stokes Raman Scattering wCARS w1 w1-w2= wR wCARS= w1 +wR w2 w1 wR
16 Darin J. Ulness, Concordia College Noisy Light Spectroscopy CARS with Noisy Light • I(2)CARS • We need twin noisy beams B and B’. • We also need a narrowband beam, M. • The frequency of B (B’) and M differ by roughly the Raman frequency of the sample. • The I(2)CARS signal has a frequency that is anti-Stokes shifted from that of the noisy beams. I(2)CARS B’ M B
17 Computer CCD Interferometer Monochromator t Sample B’ B I(2)CARS M Lens Broadband Source (noisy light) Narrowband Source Darin J. Ulness, Concordia College Noisy Light Spectroscopy I(2)CARS: Experiment
18 Darin J. Ulness, Concordia College Noisy Light Spectroscopy I(2)CARS: Spectrogram Computer CCD Interferometer Monochromator t Sample B’ B I(2)CARS M Lens Broadband Source Narrowband Source • Signal is dispersed onto the CCD • Entire Spectrum is taken at each delay • 2D data set: the Spectrogram
19 A Pixel A Pixel B B C Pixel C Darin J. Ulness, Concordia College Noisy Light Spectroscopy I(2)CARS: Spectrogram Oscillations: downconversion of Raman frequency. Decay: Lineshape function Dark regions: high intensity Light regions: low intensity
20 Darin J. Ulness, Concordia College Noisy Light Spectroscopy Spectrogram No new information can be extracted. However… • Huge oversampling gives much enhanced precision. • Visually appealing presentation of data gives much insight.
21 Darin J. Ulness, Concordia College Noisy Light Spectroscopy I(2)CARS: Data Processing Fourier Transformation X-Marginal
22 Darin J. Ulness, Concordia College Noisy Light Spectroscopy Virtues of I(2)CARS • Less expensive. • Easier experiment to perform. • Signals are more robust. • Immune to dispersion effects. • Exquisitely sensitive to relative changes in the vibrational frequency and dephasing rate constant.
23 Darin J. Ulness, Concordia College Noisy Light Spectroscopy Pyridine and Water Neat Pyridine FT Pyridine/ Water Xw= 0.55
24 Darin J. Ulness, Concordia College Noisy Light Spectroscopy Pyridine and Water Wavenumber / cm-1
25 Darin J. Ulness, Concordia College Noisy Light Spectroscopy Pyridine and Water
26 Darin J. Ulness, Concordia College Noisy Light Spectroscopy Halogen bonding
27 Darin J. Ulness, Concordia College Noisy Light Spectroscopy Prospectus • Summary: • Noisy light provides an alternative method for probing ultrafast dynamics of the condensed phase. • Experimentally it is relatively easy. • Theoretically it is relatively hard. • FTC diagram analysis helps with theoretical understanding.
28 Darin J. Ulness, Concordia College Noisy Light Spectroscopy Prospectus • Future of noisy light at Concordia: • I(2)CARS is an exquisitely sensitive probe of vibrational frequency shifts • A principle goal is to explore halogen bonding. I(2)CARS is one tool available to us.
29 Darin J. Ulness, Concordia College Noisy Light Spectroscopy Connections • Coherent Energy Transfer: • Noisy light can produce a nonlinear response. • Noisy light is “incoherent.” • Amplitude level correlation.
30 Darin J. Ulness, Concordia College Noisy Light Spectroscopy Connections Stimulus P(s) P(t) “Reaction Center” < >
31 Darin J. Ulness, Concordia College Noisy Light Spectroscopy Acknowledgements Former Students Theory Jahan Dawlaty Dan Biebighauser John Gregiore Duffy Turner Method Development Pye Phyo Aung Tanner Schulz Lindsay Weisel Krista Cosert Perrie Cole Alex Harsh Britt Berger Zach Johnson Thao Ta Hydrogen/Halogen bonding Eric Berg Jeff Eliason Diane Moliva Jason Olson Scott Flancher Danny Green Other Group Members Funding Dr. Mark Gealy, Department of Physics Dr. Eric Booth, Post-doctoral researcher Dr. Haiyan Fan, Post-doctoral researcher NSF CAREER Grant CHE-0341087 Henry Dreyfus Teacher/Scholar program Concordia Chemistry Research Fund
Darin J. Ulness, Concordia College Noisy Light Spectroscopy
A1 Darin J. Ulness, Concordia College Noisy Light Spectroscopy Utility of FTC Diagrams • Organize lengthy calculations • Error checking • Identification of important terms • Immediate information of about features of spectrograms • Much physical insight that transcends the choice of mathematical model.
A2 a P(t,{ti}) b P(s,{si}) Darin J. Ulness, Concordia College Noisy Light Spectroscopy Example: I(2)CARS • FTC analysis • Each diagram with arrows has a topologically equivalent partner diagram containing only lines: 2:1 dynamic range • Each diagram with arrows has a topologically equivalent partner diagram that has arrows pointing in the opposite direction: signal must be symmetric in t arrow segments: B, B’ correlation t-dependent line segments: B, B or B’,B’ correlation t-independent
A3 A Pixel A Pixel B B C Pixel C Darin J. Ulness, Concordia College Noisy Light Spectroscopy Example: I(2)CARS • The I(2)CARS data shows • 2:1 dynamics range • t symmetry
A4 (a) 0.30 0.25 0.20 0.15 g s 0.10 0.05 0.00 0 1 2 3 4 5 S/N (b) 0.25 0.20 0.15 0 D w s 0.10 0.05 0.00 0 1 2 3 4 5 S/N Darin J. Ulness, Concordia College Noisy Light Spectroscopy
A5 Darin J. Ulness, Concordia College Noisy Light Spectroscopy
A6 Darin J. Ulness, Concordia College Noisy Light Spectroscopy
A7 Darin J. Ulness, Concordia College Noisy Light Spectroscopy - ∆G° Product Favored - ∆H° Exothermic - ∆S° Entropically unfavorable
A8 Darin J. Ulness, Concordia College Noisy Light Spectroscopy c(3)complex = Icomplexc(3)free xfree Icomplex = Ifree at 0.21 mole fraction c(3)complex = 1c(3)free .79 c(3)complex = 3.76c(3)free