Download
1 / 1
10 likes | 94 Vues
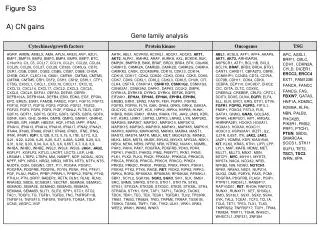
Figure S3. A. B. Inflammation sub-network. Metabolism sub-network. C. Cartilage homeostasis sub-network.

E N D
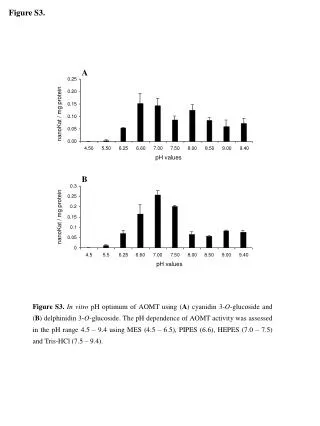
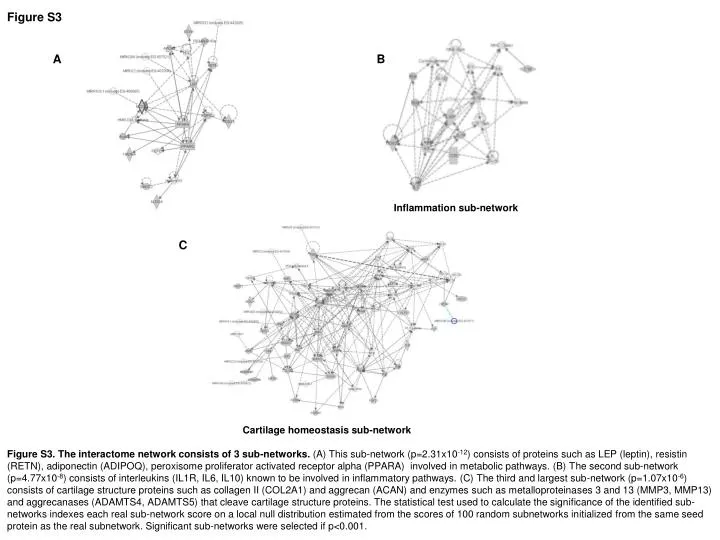
Figure S3 A B Inflammation sub-network Metabolism sub-network C Cartilage homeostasis sub-network Figure S3.The interactome network consists of 3 sub-networks. (A) This sub-network (p=2.31x10⁻¹²) consists of proteins such as LEP (leptin), resistin (RETN), adiponectin (ADIPOQ), peroxisome proliferator activated receptor alpha (PPARA) involved in metabolic pathways. (B) The second sub-network (p=4.77x10⁻⁸) consists of interleukins (IL1R, IL6, IL10) known to be involved in inflammatory pathways. (C) The third and largest sub-network (p=1.07x10⁻⁶) consists of cartilage structure proteins such as collagen II (COL2A1) and aggrecan (ACAN) and enzymes such as metalloproteinases 3 and 13 (MMP3, MMP13) and aggrecanases (ADAMTS4, ADAMTS5) that cleave cartilage structure proteins. The statistical test used to calculate the significance of the identified sub-networks indexes each real sub-network score on a local null distribution estimated from the scores of 100 random subnetworks initialized from the same seed protein as the real subnetwork. Significant sub-networks were selected if p<0.001.