Download
1 / 56
560 likes | 662 Vues
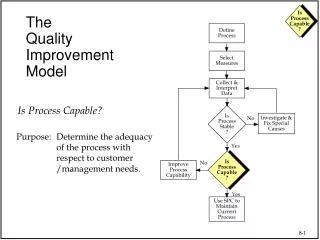
Day 3: NWS Warning Process. Paul Schlatter (CIMMS/WDTB) Jami Boettcher (WDTB) Metr 4803 April 19, 2005. Warn. Don’t Warn. Gut feeling. Ground truth. Model 1,2,3,etc guidance. Radar 1,2,3,etc Data. Expectations. Location, expected impact. Training. Satellite.

E N D
Day 3: NWS Warning Process Paul Schlatter (CIMMS/WDTB) Jami Boettcher (WDTB) Metr 4803 April 19, 2005 CASA
Warn Don’tWarn Gut feeling Ground truth Model 1,2,3,etc guidance Radar 1,2,3,etc Data Expectations Location, expected impact Training Satellite Conditions observed outside Staffing Issues Conceptual models Ongoing Mesoanalysis Equipment status Coordination & Information Processing in a Severe Weather Warning Event Communications CASA
Don’tWarn Warn Gut feeling Ground truth Model 1,2,3,etc guidance Radar 1,2,3,etc Data Expectations Location, expected impact Training Satellite Conditions observed outside Staffing Issues Conceptual models Ongoing Mesoanalysis Equipment status Coordination & Communications Warn/Don’t Warn, and Then… • Media • EMs • Wx Radio • NAWAS • Other NWS • Private Sector Public CASA
Decision to WarnThe sum of all inputs Beyond a reasonable doubt– very likely (Criminal Trial) A preferred, but rare, level of confidence in warning decisions Preponderance- More likely than not (Civil Trial) Typical level of confidence in warning decisions Warnings are a social act as much as they are a scientific decision. CASA
Warning Decision • How much preponderance do YOU need? • Default: Don’t Warn • What it takes to tip the scales involves science, technology and human factors Warn Don’t Warn CASA
Forecasters Have Varying Trigger Thresholds What level of confidence do forecasters need to issue a tornado warning? Given same event/similar data, different personalities require different tornado probability levels to trigger a decision to warn CASA
Analytical and Intuitive Decision Making • Analytical: • Little time pressure • Goal is optimization (best option) • Computational complexity (cost effective analysis) • Intuitive: • Significant time pressure • Dynamic conditions • Lives at stake CASA
The Role of Intuition • “Your intuitions are not accidental. They reflect your experience.” Gary Klein • Experience is not the same as expertise • Intuition is the voice of your experience. Using it effectively is part of expertise. • Your intuition responds (a thought or a feeling) to data cues, often prompting investigation CASA
The Role of Intuition Two different types of intuitive responses: • The data cues fit a pattern “it makes sense”: I’ve seen this before; I know what it means; I know what to look for; I know what to do • The data cues do not fit a pattern “it doesn’t make sense”: There is something missing here; something doesn’t seem right; step back and re-evaluate CASA
It Does Make Sense • Pattern recognition • BWER in a developing storm • Which data cues to look for • Mesocyclone in mid levels • What is expected to happen next • Hook at low levels • How to respond • Get that warning ready CASA
It Doesn’t Make Sense • Forecaster faced with contradictoryinformation: • TDA detections in supercell; rotation not indicated in base data • Severe Thunderstorm warning in effect • Environment not favorable for tornadoes • Reports of wind damage; cause ambiguous CASA
All relevant data has weight Warn Don’t Warn Multiple TDAs High shear in SRM Supercell reflectivity structure Reports of damage SRM shear lacks height continuity Gust front well south of TDA Not climatologically favored Damage could be from high wind CASA
Forecaster adds expertise“Ultimately…it just didn’t look right!”-Warning Forecaster on duty • Concerned about TDA and 0.5 shear but… • Environment not favorable for tornadoes • Didn’t fit climatology • Signature lacked height continuity • Reports were ambiguous as to cause so… • Readied tornado warning pending better ground truth or more convincing radar signature CASA
The Warning Process • Anticipation/Expectation • Data Selection • Feature Recognition • Spotter Reports/Ground Truth • Warning Generation/Dissemination • Non-Meteorological Factors CASA
The Warning ProcessAnticipation/Expectation Affects: Staffing, logistics, system configurations, threat expectation, readiness Note: Assessment process is continual CASA
The Warning ProcessAnticipation/Expectation • Assessment process is continual • Subtle changes in data shift expectations CASA
Anticipation helps you know what to look for…where to spend your time CASA
Expectations Have Other Impacts…Such as Staffing • Routine - 3 • 2 forecasters • Short term • Long term • 1 Technician • “Average”Severe Weather - 5 • 2 forecasters • Short term • Long term • 1 Dedicated warning forecaster • 1 HAM radio operator • 1 Technician • High end event (such as May 3,1999) - 10 • 2forecasters • Short term (Part-time warning forecaster) • Long term (Part-time warning forecaster) • 2 to 3 Dedicated warning forecasters • sectored warnings • 1 to 2 HAM radio operators • 1 Verification specialist • 2 Technicians CASA
Expectations Help Determine Equipment Configuration These may change throughout event CASA
Holding Onto Expectations:An SA Demon • Wrong mental model may result in incorrect interpretation of data • Prevents or slows shift in SA • “People tend to explain away conflicting cues to fit the mental model they have selected” (Endsley) • “tornadoes don’t happen here” CASA
Expectations Often Need to Change During an Event • Marginally severe storms expected, with small hail and strong winds • No hail reported, but high radar rainfall estimates assumed to be hail contaminated • Storms missing gages; did not seek other ground truth • Storms over area of new urban development • Detention ponds and other design elements assumed to be sufficient for runoff • Result: flash floodingin small basin areas CASA
Data SelectionWhat you see depends on what you choose to look at…and there are a lot of choices! CASA
Data SelectionWorkstation Configuration affects the ease of data selection • Numerous data sets • Satellite • Radar • Lightning • Surface obs • Model forecasts • Animations/loops • Image overlay/fade • Detailed Maps • Auto update • Heavy on base data • Algorithms as safety net CASA
Feature RecognitionBased on training, but also on real-time data depiction Cyclonic rotation This feature is interpreted differently, depending on where it is relative to the radar divergence convergence CASA
Aspect Ratio Viewing Angle Feature RecognitionStorms change appearance simply due to sampling effects Range/Radar Horizon VCP/Cone of Silence CASA
Available Radars Unavailable Radars Feature Recognition Depends on radar selected as different radars present the storm differently % % A % % % % B % % Storm being sampled % % CASA
Radar perspectives impact feature recognition and perceived threat Radar A -far Hail? Lost data Radar B -close Tornado Tornado CASA
Feature RecognitionProduct and setting dependent Rotation not apparent Better storm motion, rotation more apparent CASA
Feature recognition goes back to understanding conceptual models… • Classic supercells • HP supercells • LP Supercells • Squall line tornadoes • Ascending tornadoes • Descending tornadoes • Cyclic evolution CASA
…then recognizing those conceptual models in the data you perceive. 3.4° • Bounded Weak Echo Region (BWER) • Intense updraft forms a hole in the reflectivity core. 2.4° BWER BWERs not typically seen this far out 1.5° Typical BWER heights 0.5° CASA
Feature recognition in base data vs algorithm output Lead Time on First Warning for Each Storm CASA
Feature recognition in base data vs algorithm output • Much effort put towards base data interpretation • Algorithm decisions based on a single radar • Human decisions based on multiple radars, surface data, spotter reports, upper air analysis, thermodynamic variables…. CASA
CO-OP Spotter Reports/Ground TruthValue and weight must be judged CASA
SA Demons: Misplaced Salience • Salience is the “compellingness” of a piece of data, often dependent on how it is presented • Beeps, buzzers, and flashing red boxes! • Data given greater salience because it isn’t there • Lack of information (we humans tend to think) means the phenomenon doesn’t exist • May be “missing” due to sampling limitations CASA
No reports = Nothing HappeningAbsence of evidence does not equal evidence of absence! Path of May 3rd, 1999 tornado through Moore, Oklahoma. The Daily Oklahoman CASA
Warning Generation and Dissemination • Specificity • What, when, where • Consistency • Internal/external • Certainty • The tone of the message • Clarity • Simple words with precise meaning • Accuracy • Timely, accurate and complete information CASA
The Warning Response Process – Case Study F4 Tornado Strikes Parsons Manufacturing Plant July 13, 2004 Roanoke, IL More than 120 employees threatened • Decision to take shelter not instant response to a warning • Hearing • Understanding • Believing • Personalizing • Confirming • Deciding and responding CASA
The Warning Response Process – Case Study F4 Tornado Strikes Parsons Manufacturing Plant July 13, 2004 • Hearing • NOAA Weather Radioreceipt of a Severe Thunderstorm Warning 12 minutes prior to the tornado (not typical) • WFOs promote local preparedness CASA
The Warning Response Process – Case Study F4 Tornado Strikes Parsons Manufacturing Plant July 13, 2004 • Understanding • Company severe weather plan implemented • Employees not immediatelysent to shelters • Employee spottersactivated CASA
The Warning Response Process – Case Study F4 Tornado Strikes Parsons Manufacturing Plant July 13, 2004 • Believing • Employees sent todesignated shelters perspotters recommendation • Concurrent with Tornado Warning issued seven minutes prior to the tornado CASA
The Warning Response Process – Case Study F4 Tornado Strikes Parsons Manufacturing Plant July 13, 2004 • Personalizing • Strong safety plan existedbecause plant manager hadprevious tornado experience • Monthly meetings • Tornado drills at least twice a year CASA
The Warning Response Process – Case Study F4 Tornado Strikes Parsons Manufacturing Plant July 13, 2004 • Confirming • Confirmation occurred when tornado hit plant • Cars blown from parking lot into side of building • Steel beams weighing up to a ton were “pulled into the vortex like match sticks.” CASA
The Warning Response Process – Case Study F4 Tornado Strikes Parsons Manufacturing Plant July 13, 2004 • Deciding and responding • “Looking at the pictures of the nearly demolished plant, a person wouldn’t think it possible that more than 120 employees got through that storm with no injuries.” • Mike Looney, Chief NWS Central Region Services Division CASA
Non-Meteorological FactorsWarnings are not issued in a vacuum • Staffing • Number and experience level • Workload • Use of warning coordinator • Volume of calls (incoming/outgoing) • Equipment configuration (hardware/software) • Equipment problems • Weather at station (affects number of calls and equipment reliability) • Weather affecting large metro (usually calls increase) • Other human factors (stress, fatigue, pressure) • Situation Awareness (SA) • Communication/Coordination (internal/external) CASA
SA and “warning coordinator”Maintain the Event Level SA Tasks include: • Assessing staff/workload • Modify sectors • Monitor stress/fatigue • Communication/coordination • Intra/Inter • Monitor equipment status • Multiple vulnerabilities here! • Ensuring quality and distribution of products • Monitoring office’s message to customer • Document actions and prepare for aftermath CASA
Situation AwarenessElements that support individual SA • Workstation configuration • Clearly defined roles and responsibilities • Individual can focus on tasks they are responsible for • Not distracted by concern that something is not getting done CASA
Situation AwarenessSectorizing can support individual SA • Advantages • Divide the workload • Focus on base data • Maintain higher SA • Disadvantages • Coordination becomes a challenge CASA
Situation AwarenessElements that support Team SA • Leadership • Roles and responsibilities are well defined and understood • Promote familiarity among staff, supporting verbal and nonverbal communication • Minimize “face threat” • The penalty for calling attention to a person’s error • The higher the face threat, theless likely an error or an omission will be communicated CASA
Situation AwarenessElements that support Team SA • Preparation, Planning • Roles and responsibilities are well defined, understood and practiced • “predefined severe weather shift duties…allowed the staff to focus on specific duties with knowledge that all necessary tasks were being completed…minimized duplication of effort and maximized warning and communications performance.” • Expect the unexpected CASA