Download
1 / 21
210 likes | 316 Vues
Topology control in wireless networks. Channel Transmission rate this class Transmission power Directional antennas’ direction Node placement. Q. I. 1. 0. Q. 11. 10. I. QPSK (Quadrature Phase Shift Keying): 2 bits coded as one symbol needs less bandwidth compared to BPSK

E N D
Topology control in wireless networks • Channel • Transmission rate this class • Transmission power • Directional antennas’ direction • Node placement
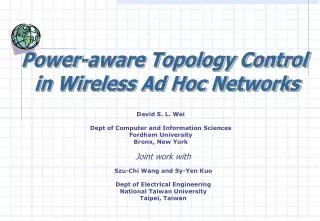
Q I 1 0 Q 11 10 I • QPSK (Quadrature Phase Shift Keying): • 2 bits coded as one symbol • needs less bandwidth compared to BPSK • symbol determines shift of sine wave • Often also transmission of relative, not absolute phase shift: DQPSK - Differential QPSK 00 01 A t 01 11 10 00 Phase Shift Keying • BPSK (Binary Phase Shift Keying): • bit value 0: sine wave • bit value 1: inverted sine wave • very simple PSK • low spectral efficiency • robust, used in satellite systems
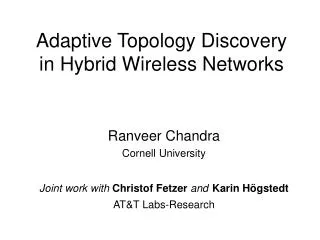
Example: 16-QAM (4 bits = 1 symbol) Symbols 0011 and 0001 have the same phase φ,but different amplitude a. 0000 and 1000 have same amplitude but different phase Used in Modem Q 0010 0001 0011 0000 φ I a 1000 Quadrature Amplitude Modulation • Quadrature Amplitude Modulation (QAM): combines amplitude and phase modulation • It is possible to code n bits using one symbol • 2n discrete levels • bit error rate increases with n
Rate Adapation • 802.11b • 11, 5.5, 2, 1 Mbps • 802.11a • 6, 9, 12, 18, 24, 36, 48, 54 Mbps • 802.11n per stream • 20MHz: 7.2, 14.4, 21.7, 28.9, 43.3, 57.8, 65, 72.2 Mbps • 40MHz: 15, 30, 45, 60, 90, 120, 135, 150 Mbps
Question • What happens if we have both “slow” and “fast” senders associated with the same AP?
Intuition • Every node gets the same chance to access the network • When a node grabs the medium, it can send the same sized packet (regardless of its rate) • So fast and slow senders will both experience low throughput
Performance Anomaly of 802.11 Martin Heusse, Frank Rousseau, Gilles-Berger Sabbatel, Andrzej Duda LSR-IMAG Laboratory Grenoble, France
Performance of DCF Overall Transmission time (T) : Constant Overhead (tov) : Proportion of useful throughput (p):
Performance of DCF Taking into account collisions and exponential backoff, Overall Transmission Time (T(N)) becomes : Time spent in contention (tcont(N)) :
Performance of DCF Assuming that multiple successive collisions are negligible, Proportion of collisions (Pc(N)) experienced for each packet acknowledged successfully : Proportion (p) of useful throughput obtained by a host :
Performance Anomaly of 802.11b Fast Host : Slow Host : R : transmission rate of ‘fast’ host (11Mbps) r : transmission rate of ‘slow’ host (5.5, 2 or 1 Mbps) tRov : overhead time of ‘fast’ host trov : overhead time of ‘slow’ host
Performance Anomaly of 802.11b Result : The fast hosts transmitting at a higher rate ‘R’ obtain the same throughput as the slow host transmitting at a lower rate ‘r’. i.e.
Performance Measurements • 4 notebooks – Marie, Milos, Kea, and Bali • Linux RedHat 7.3 (kernel 2.4.18) • 802.11 cards based on Lucent Orinoco and Compaq WL 110 • Lucent Access Point • Wvlan driver for the wireless card
Performance Measurements • Tools used • netperf – generates TCP and UDP traffic to a target host running netserver and measures throughput obtained at each second. • tcpperf – generates TCP traffic and measures throughput obtained at each second. • udpperf – generates UDP traffic and measures throughput obtained at each second.
Performance Measurements • Hosts with different rates, no mobility
Performance Measurements • Hosts with different rates, no mobility
Performance Measurements • Hosts with different rates, real mobility
How to make fast hosts send fast and avoid being slowed down by slow hosts?